
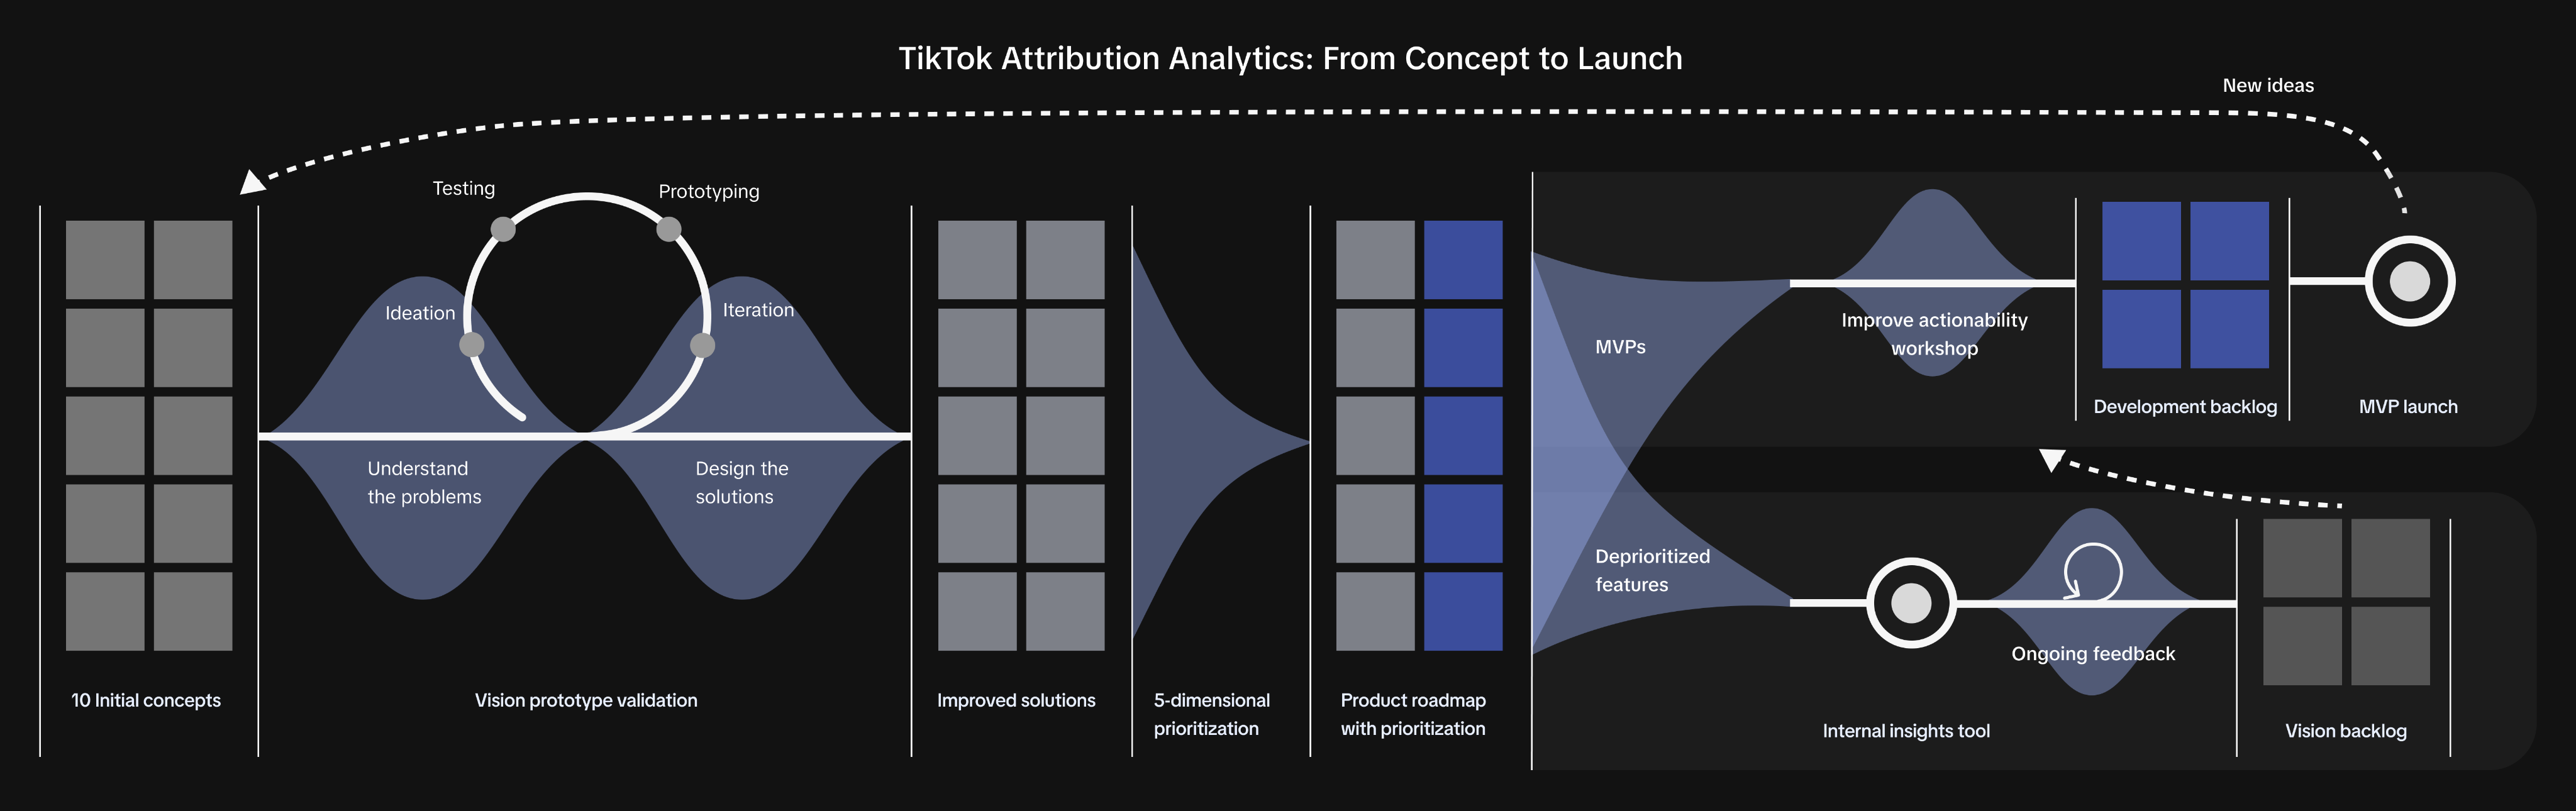
TikTok Attribution Analytics: From Concept to Launch
Summary
I led the design of TikTok’s first comprehensive attribution platform — Attribution Analytics, addressing advertiser trust gaps caused by data discrepancies and last-click bias. Within a year, the team launched four core data features globally and an internal insights tool with advanced metrics. By driving data visualization design, hypothesis-driven research, and iterative validation, the platform increased revenue penetration to 26%-62% across SMB–KA segments. I also facilitated xfn retros to improve workflows, shaped the product roadmap using data-driven prioritization frameworks, and led design workshops to enhance data actionability and user education. The result was a trusted, action-oriented measurement solution that clarified true conversion value and informed advertiser optimization decision-making.
My Role
Lead Designer
Company
TikTok
Date
2023-2024
Scope
12 months; 15+ XFN partners across PM, Data Science, UXR, Content, Client-facing teams, Engineering, QA, Visual design, and partner product teams
Background
Attribution refers to identifying the contribution of different marketing channels along the customer journey, helping advertisers understand which ad campaign touchpoints actually drive conversions. Accurate attribution directly impacts advertiser trust and campaign strategy, which in turn affects ad revenue.
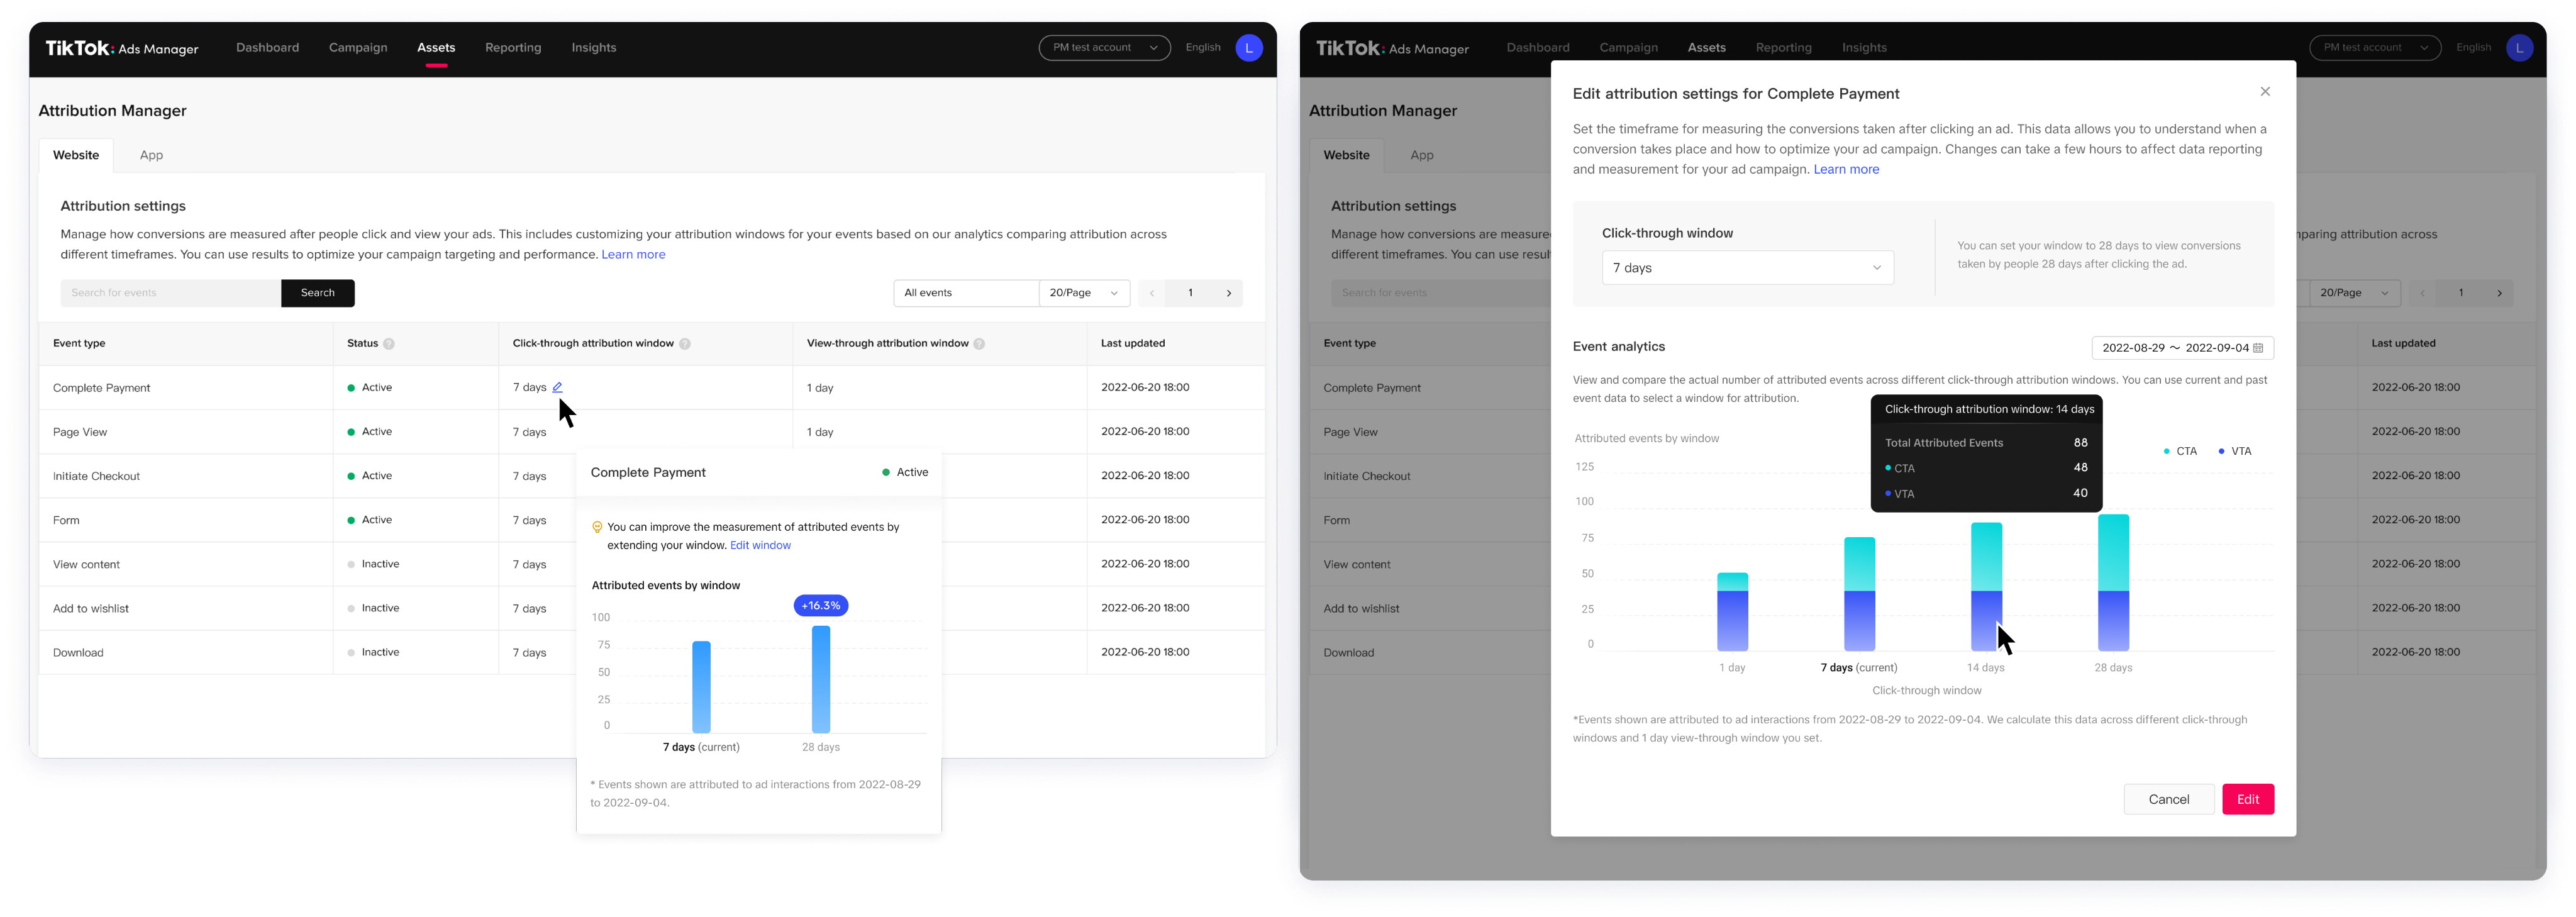
Our team’s starting point was Attribution Manager, TikTok’s first user-facing attribution product. However, advertiser feedback quickly revealed that this settings-only tool was insufficient.
Problem
Through advertiser feedback and market research, we identified a critical challenge: there is no effective attribution solution within TikTok or in the market to highlight TikTok’s unique consumer journey (view-through conversions, long cycle, multi-touch vs. traditional last-click models).
This results in TikTok and third-party measurement discrepanciesA post-purchase survey revealed 79% of TikTok-driven purchases are not captured through last-click models.
- No effective attribution solution for data discrepancies: data between TikTok and third-party tools (e.g., Google Analytics) often conflicts.
- Difficulty highlighting TikTok’s unique value: traditional last-click models undervalue TikTok, ignoring view-through attribution (VTA) and longer conversion cycles.
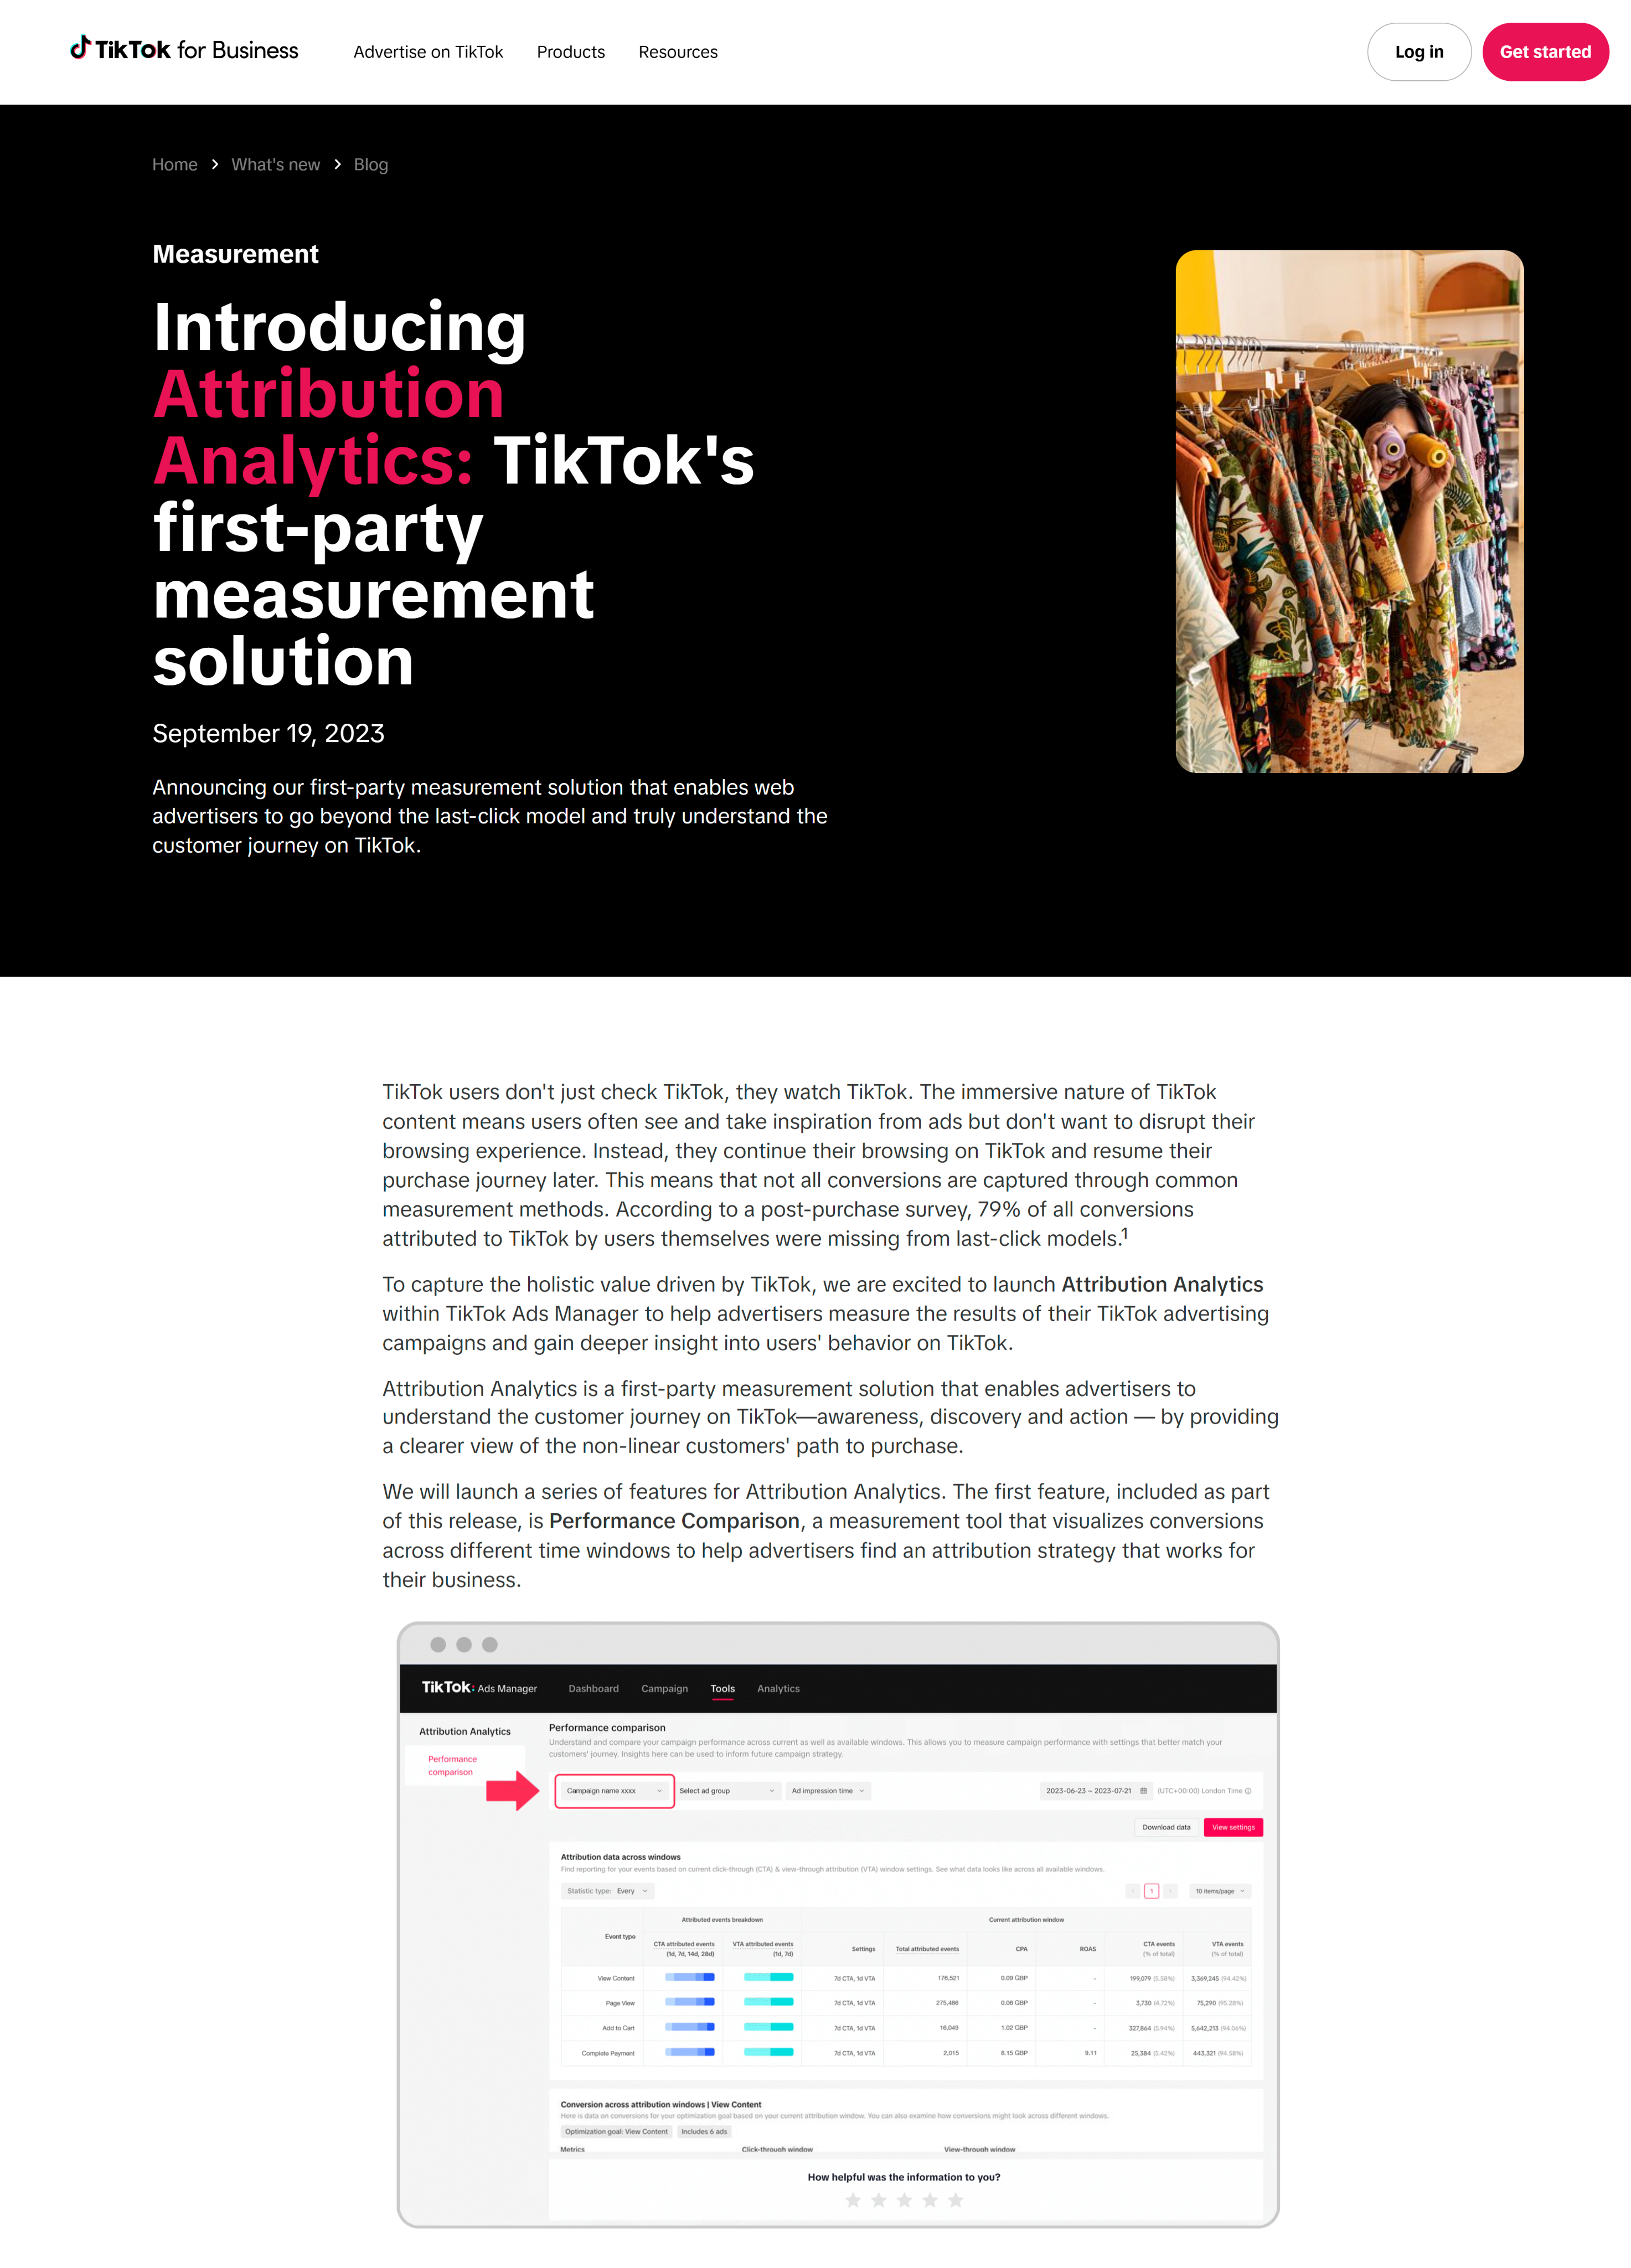
Our team introduced Attribution Analytics, a data insights product designed to:
- Highlight TikTok’s unique consumer journey beyond last-click.
- Strengthen advertiser trust and investment in TikTok ads by providing more accurate, actionable insights.
In this case study, I’ll cover two major milestones:
- Rapidly design and validate 10 high-value data feature concepts in user research;
- Launch prioritized features as MVP, then scale and optimize across the full feature set.

Approach & Design Strategy
Challenges
Two product-specific challenges:
- This was a brand new product, with many attribution features that had no direct market benchmarks.
- Initial requirements were highly ambiguous. We needed to explore and define critical details—what data to include, at what dimension and granularity, and how each element could deliver value.
Two challenges observed in existing measurement products:
- Low actionability & interpretability: insights were difficult to apply, leading to trust gaps.
- Divergent advertiser needs: KA required multi-dimensional attribution depth, SMBs needed simplified roll-ups, and MM demanded a balance of detail and efficiency.
Design Strategy
- To address these, I developed five guiding principles for designing Attribution Analytics:
- Define Metrics & Dimensions: Reveal data that delivers value. Structure revenue-relevant metrics into KPIs, dimensions into primary scopes, secondary filters, and time ranges as standardized building blocks.
- Granularity & Aggregation: Balance detailed drill-downs and high-level roll-ups, serving different levels of measurement sophistication while preventing data overload.
- Effective visualization: Use charts, tables, KPI cards (quick checks), interactive filters (granularity control), narratives (clarity), and dashboards (holistic views) to improve perceived value and reduce cognitive load.
- Actionability: Surface the right next step at the right time. Frame recommendations around business value, personalization level, measurable triggers, and contextual scenarios.
- Product Education: Embed clear, contextual, and consistent narratives across all touchpoints to improve perceived value, trust, and adoption.
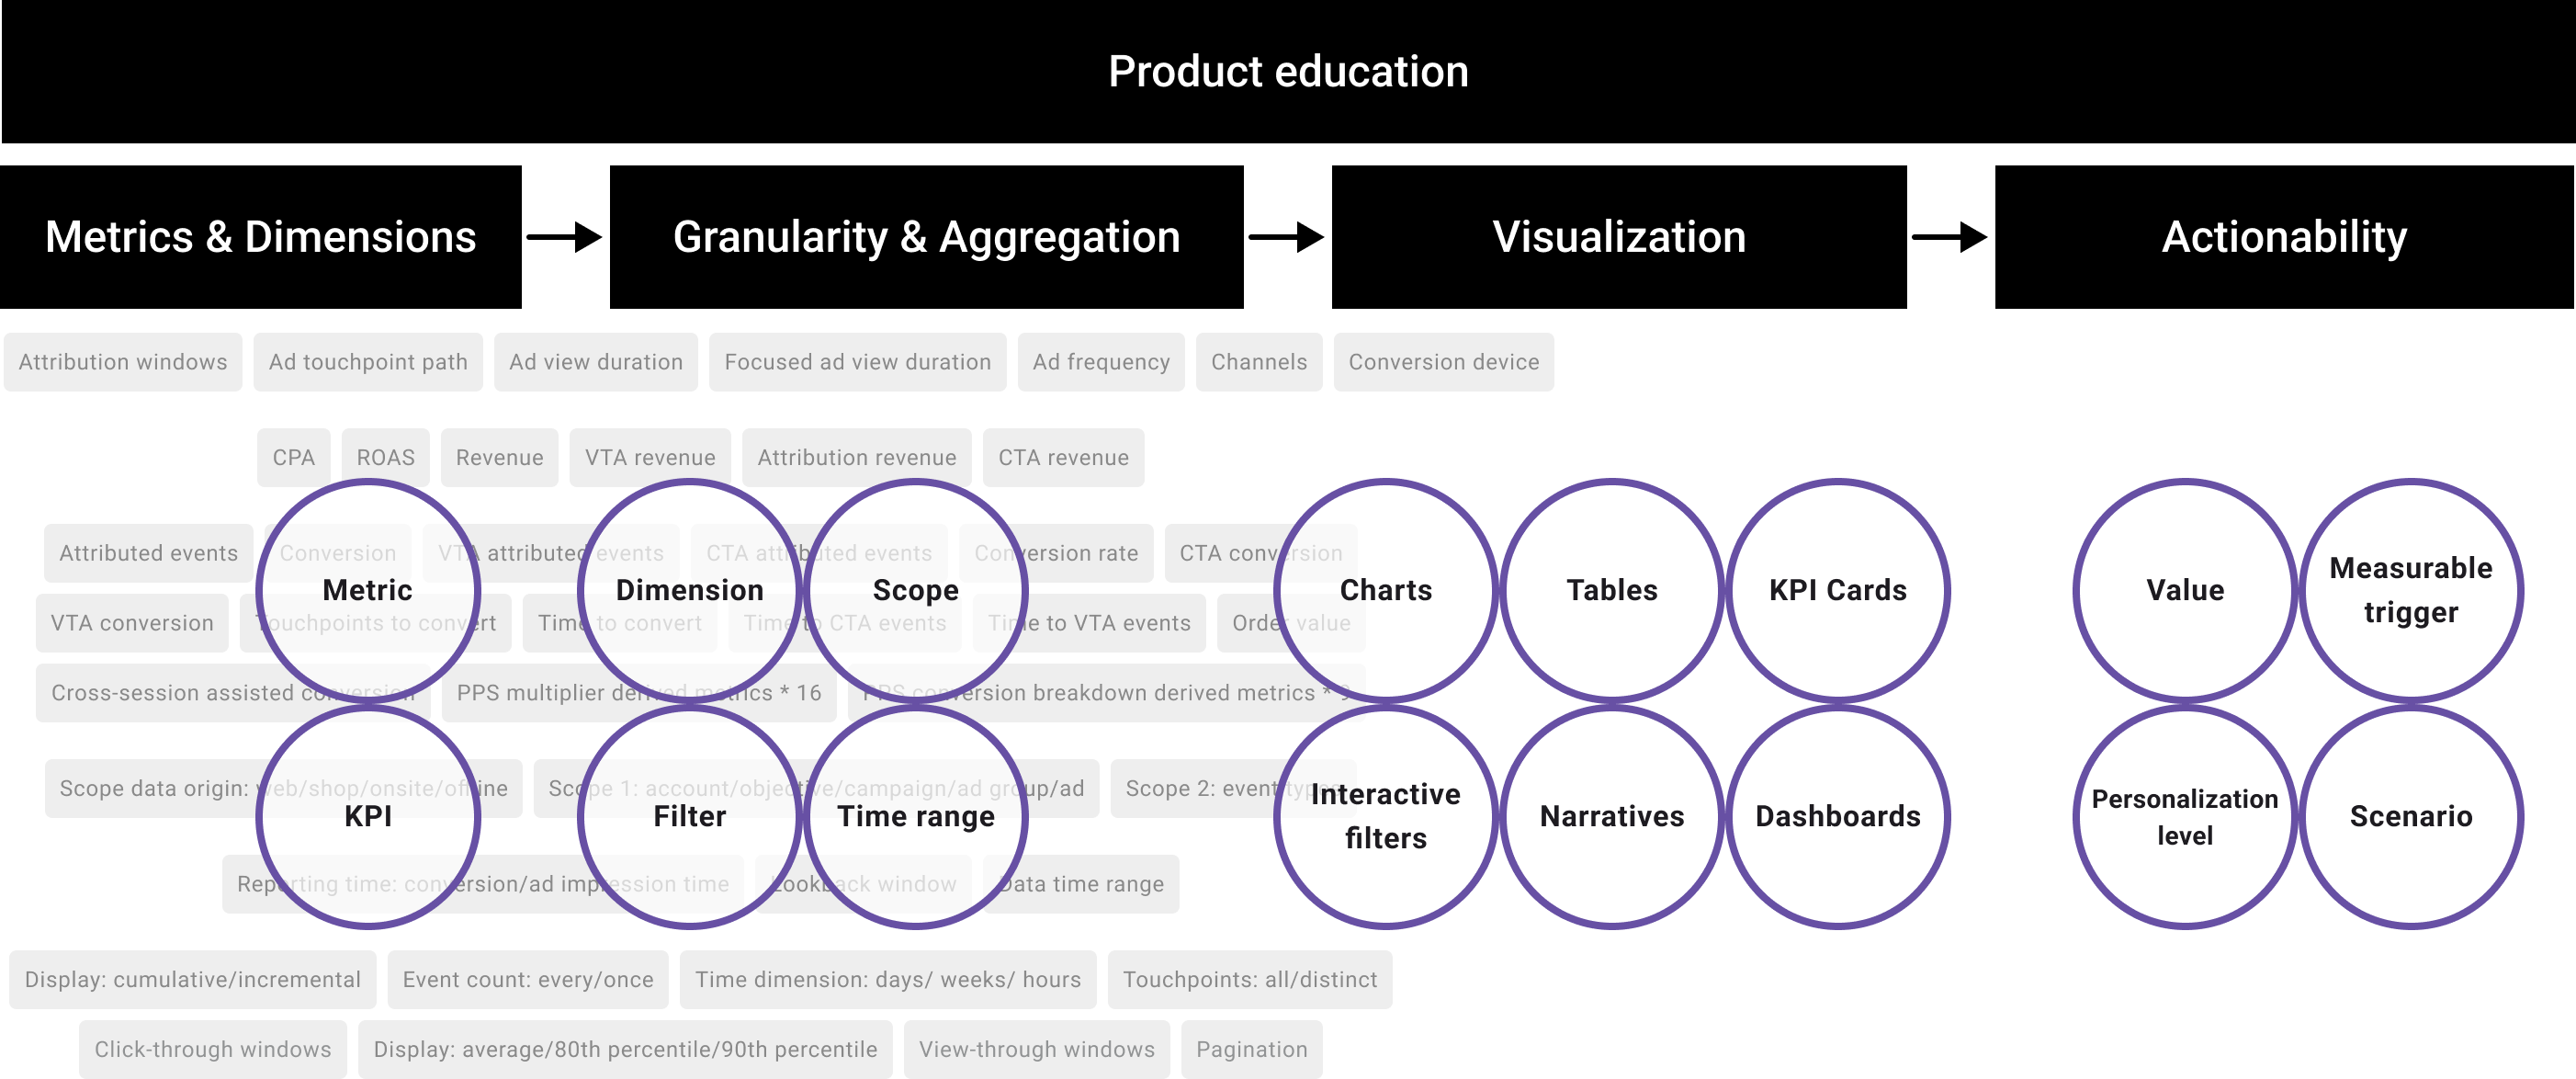
Design strategy: defining metrics and dimensions, granularity & aggregation, visualization, actionability, and product education.
Vision Prototype
From ambigous to concret
Partnering with Product and Data Science, I designed 10 medium-fidelity data feature proposals.
Challenges I addressed:
- Analyzed real advertiser data to translate vague requirements into effective scenarios for each feature.
- Proposed and revised 20+ hypotheses around metrics, dimensions, visualization, and actionability.
- Selected a proper tool for rapid prototyping, balancing visualization capability, compatibility, and reusability.
Desirability prioritization metrics
To prioritize desirability of each feature, PM and I defined three core metrics:
- Reliability – can advertisers trust this data?
- Interpretability – can advertisers easily understand the data?
- Actionability – can this data guide next steps effectively?
Validation and iteration
Over 6 weeks, with close collaboration across Design, UXR, Product, and Data Science:
- Prototyped 60 interactive prototypes with live data for each advertiser, ensuring feedback reflected real-world user behavior;
- Rapidly completed 33 design iterations, evolving from 20 to 65+ validated hypotheses;
- Improved every feature across reliability and interpretability.
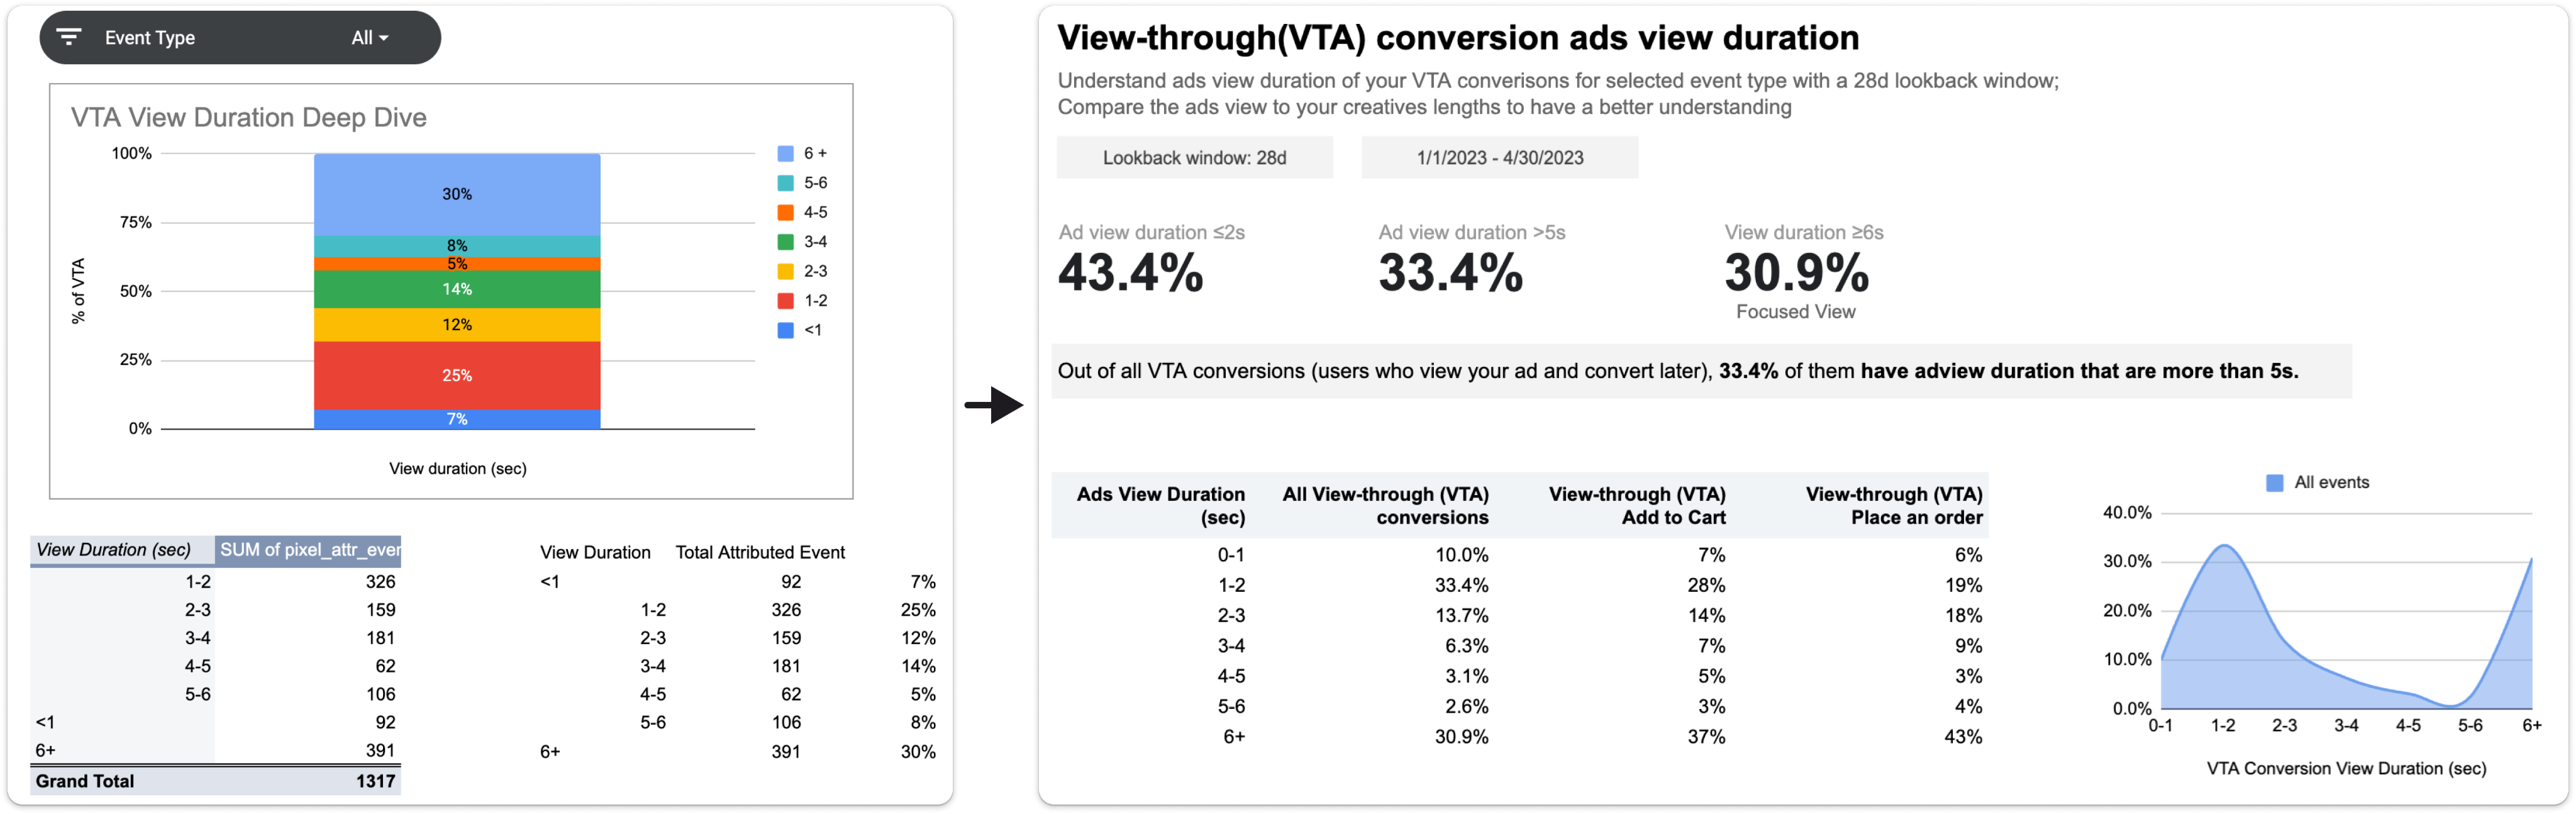
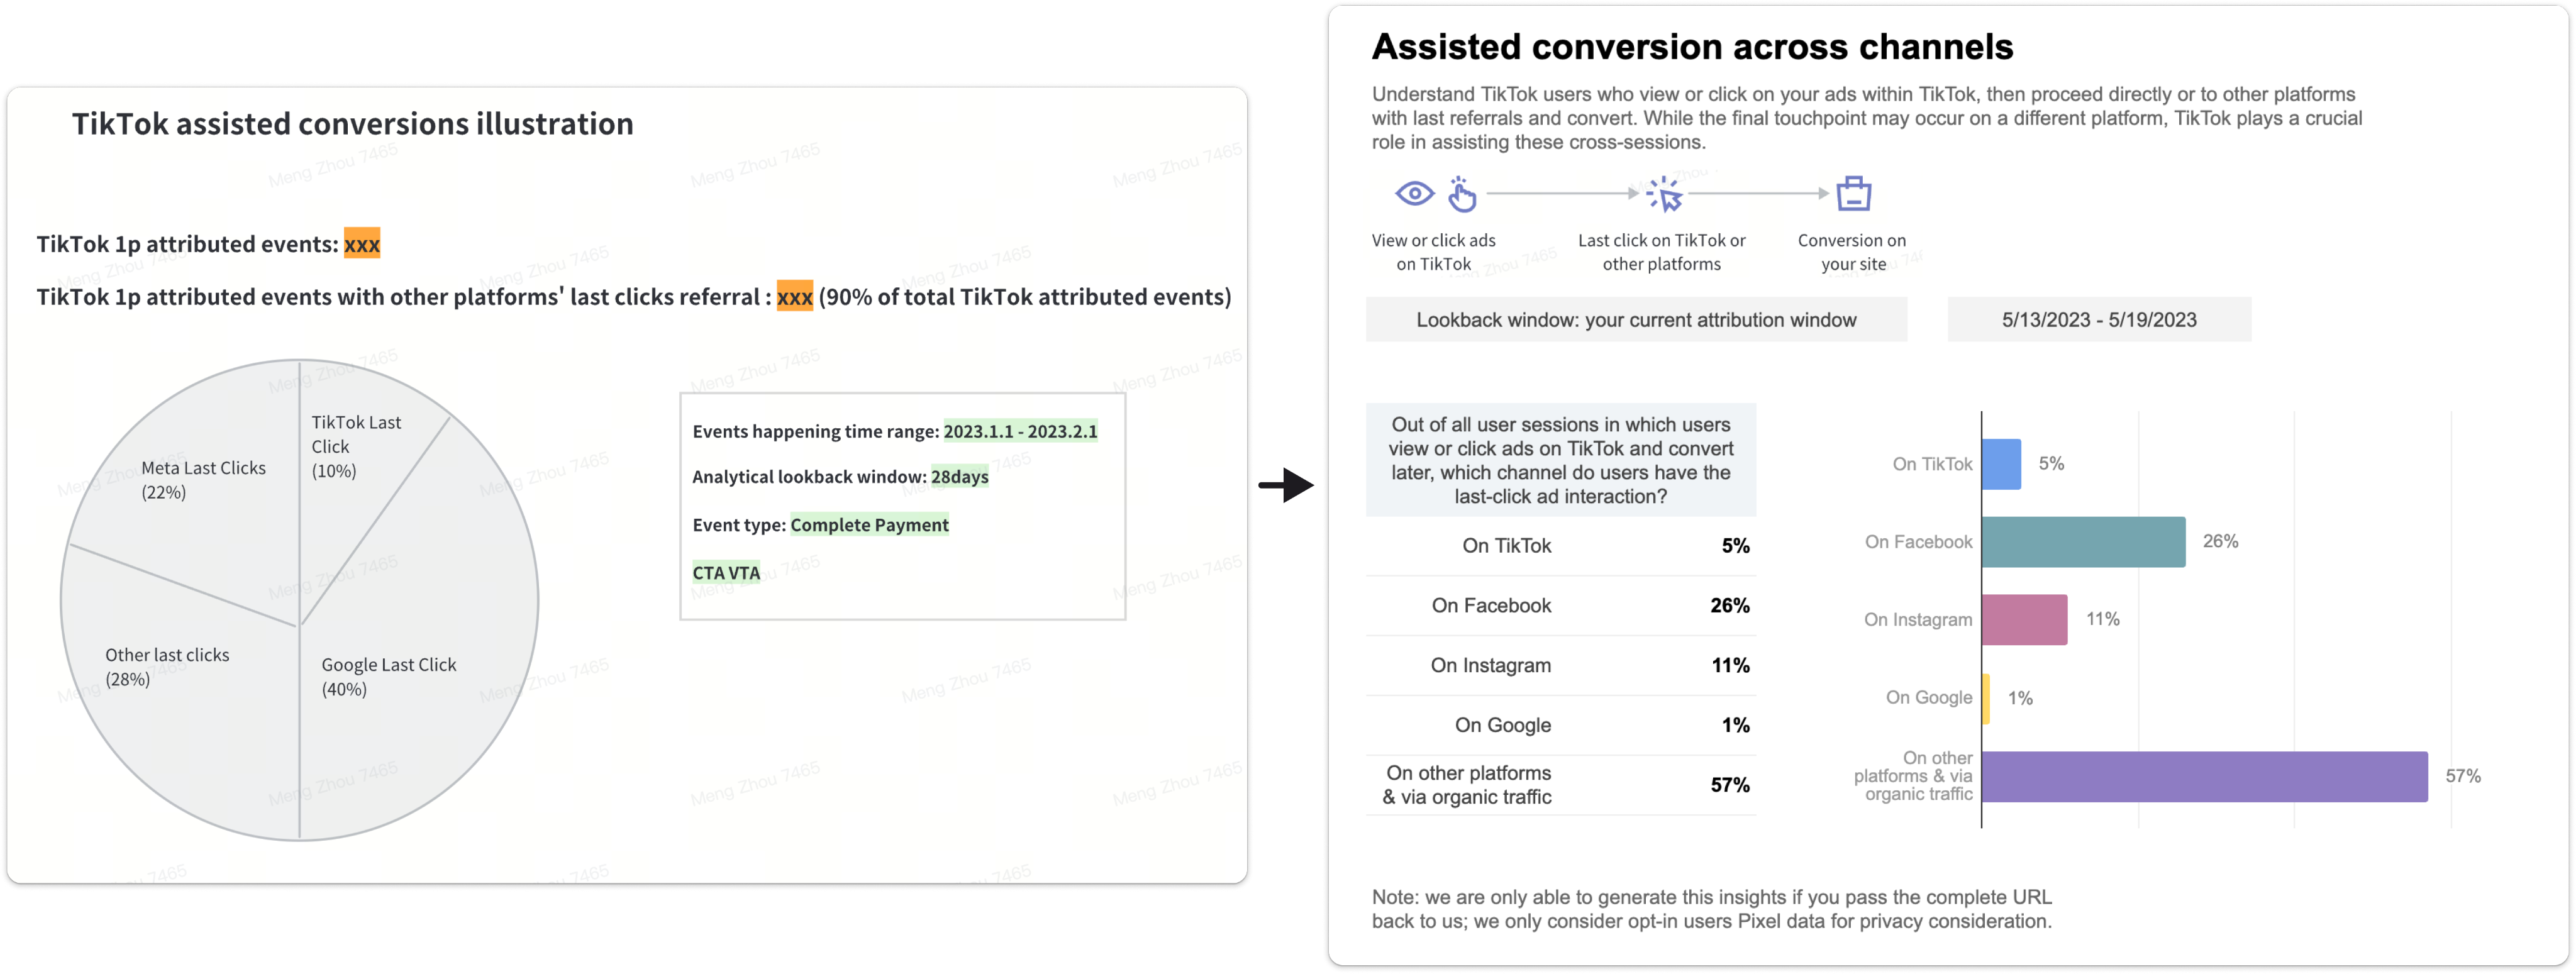
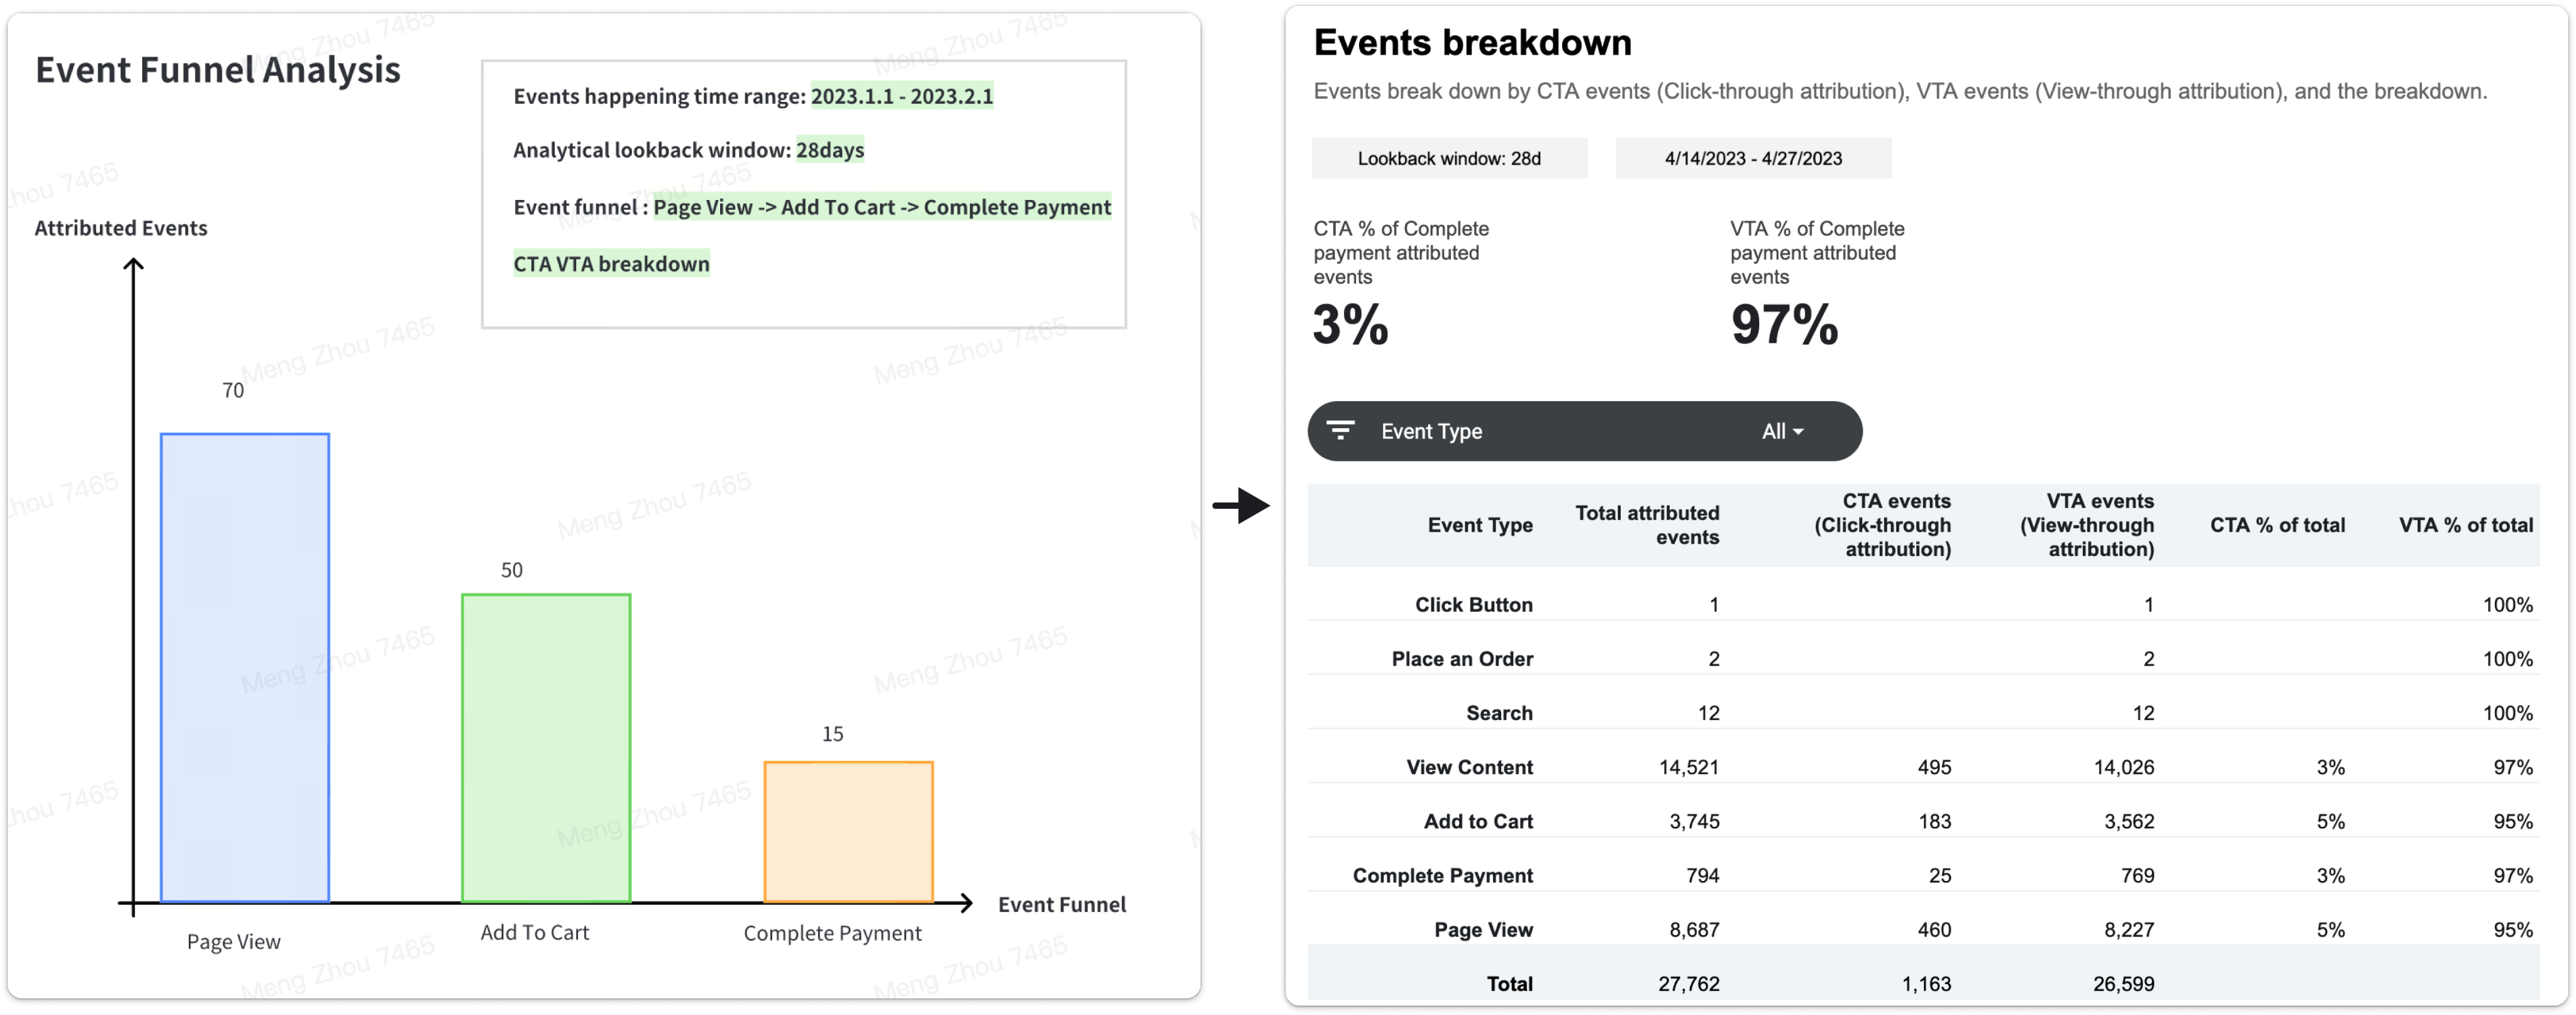
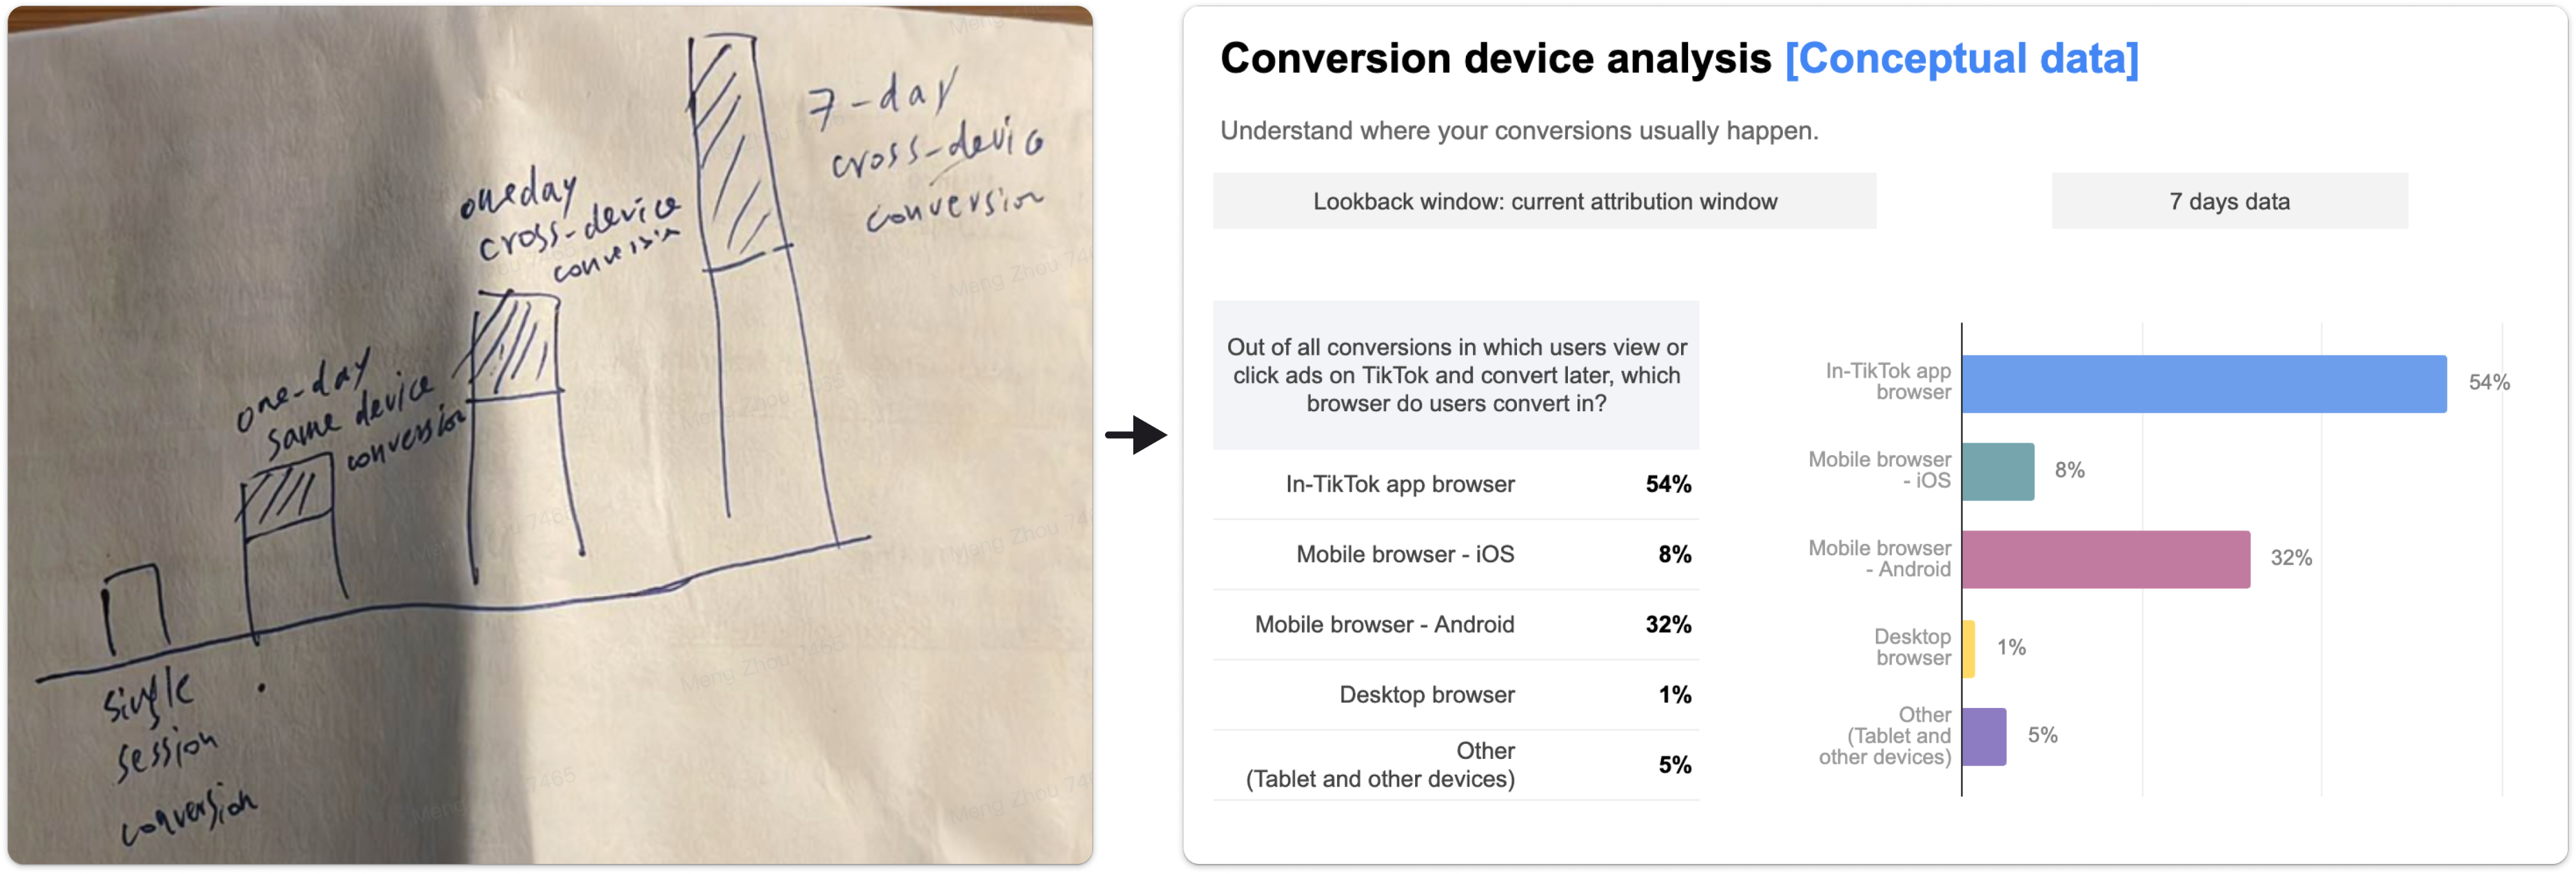
Example: 10 features after 33 iterations, from concept to medium-fi in teractive prototypes, validated with real data and user feedback.
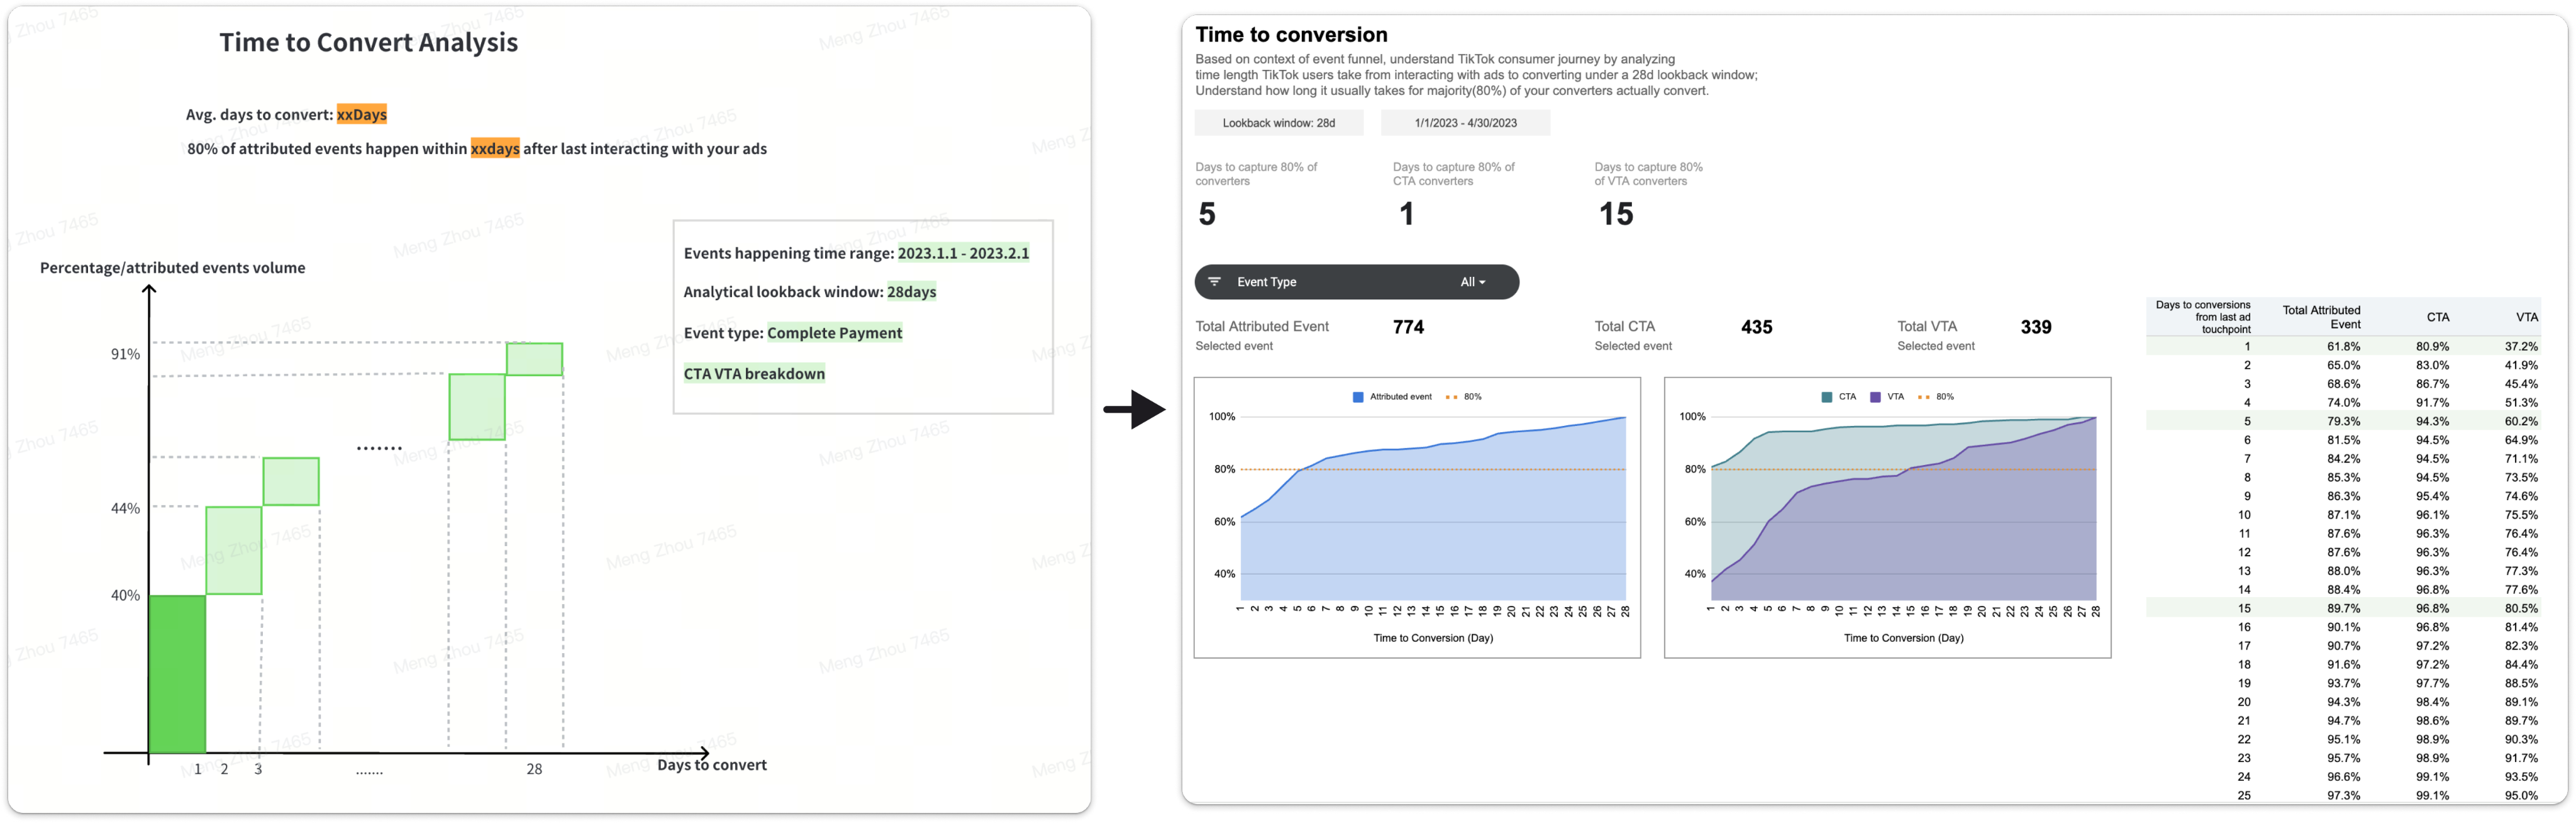
Example: Progressive validation journey for Time to Conversion feature
Defining, testing, and iterating on:
1. Metrics & dimensions & granularity hypotheses: What data to show, and at what granularity?
2. Visualization hypotheses: How should the data be displayed for clarity?
3. Product education hypotheses: How do we help advertisers interpret and act on insights?

MVP
Prioritization and roadmap
To complement the three desirability metrics (Reliability, Interpretability, Actionability), we added two feasibility dimensions post vision prototype validation:
- Data Scalability: Can data support all major advertiser types and scenarios?
- Data Quality: Is the data accurate, complete, consistent, and timely, reflecting true TikTok conversion value?
Using this five-dimensional prioritization framework (Reliability, Interpretability, Actionability, Data Scalability, Data Quality), we built the roadmap:
- 4 features for MVP, delivering rapid market value.
- Remaining features implemented in an internal data insights tool used by client-facing teams to support advertisers and collect ongoing feedback.
MVP Launch
After a year of iterative design, validation, and cross-functional collaboration, we launched Attribution Analytics through staged rollouts — evolving from a single-feature alpha to limited-market betas, and ultimately to global GA with four core features, supported by a structured GTM plan.
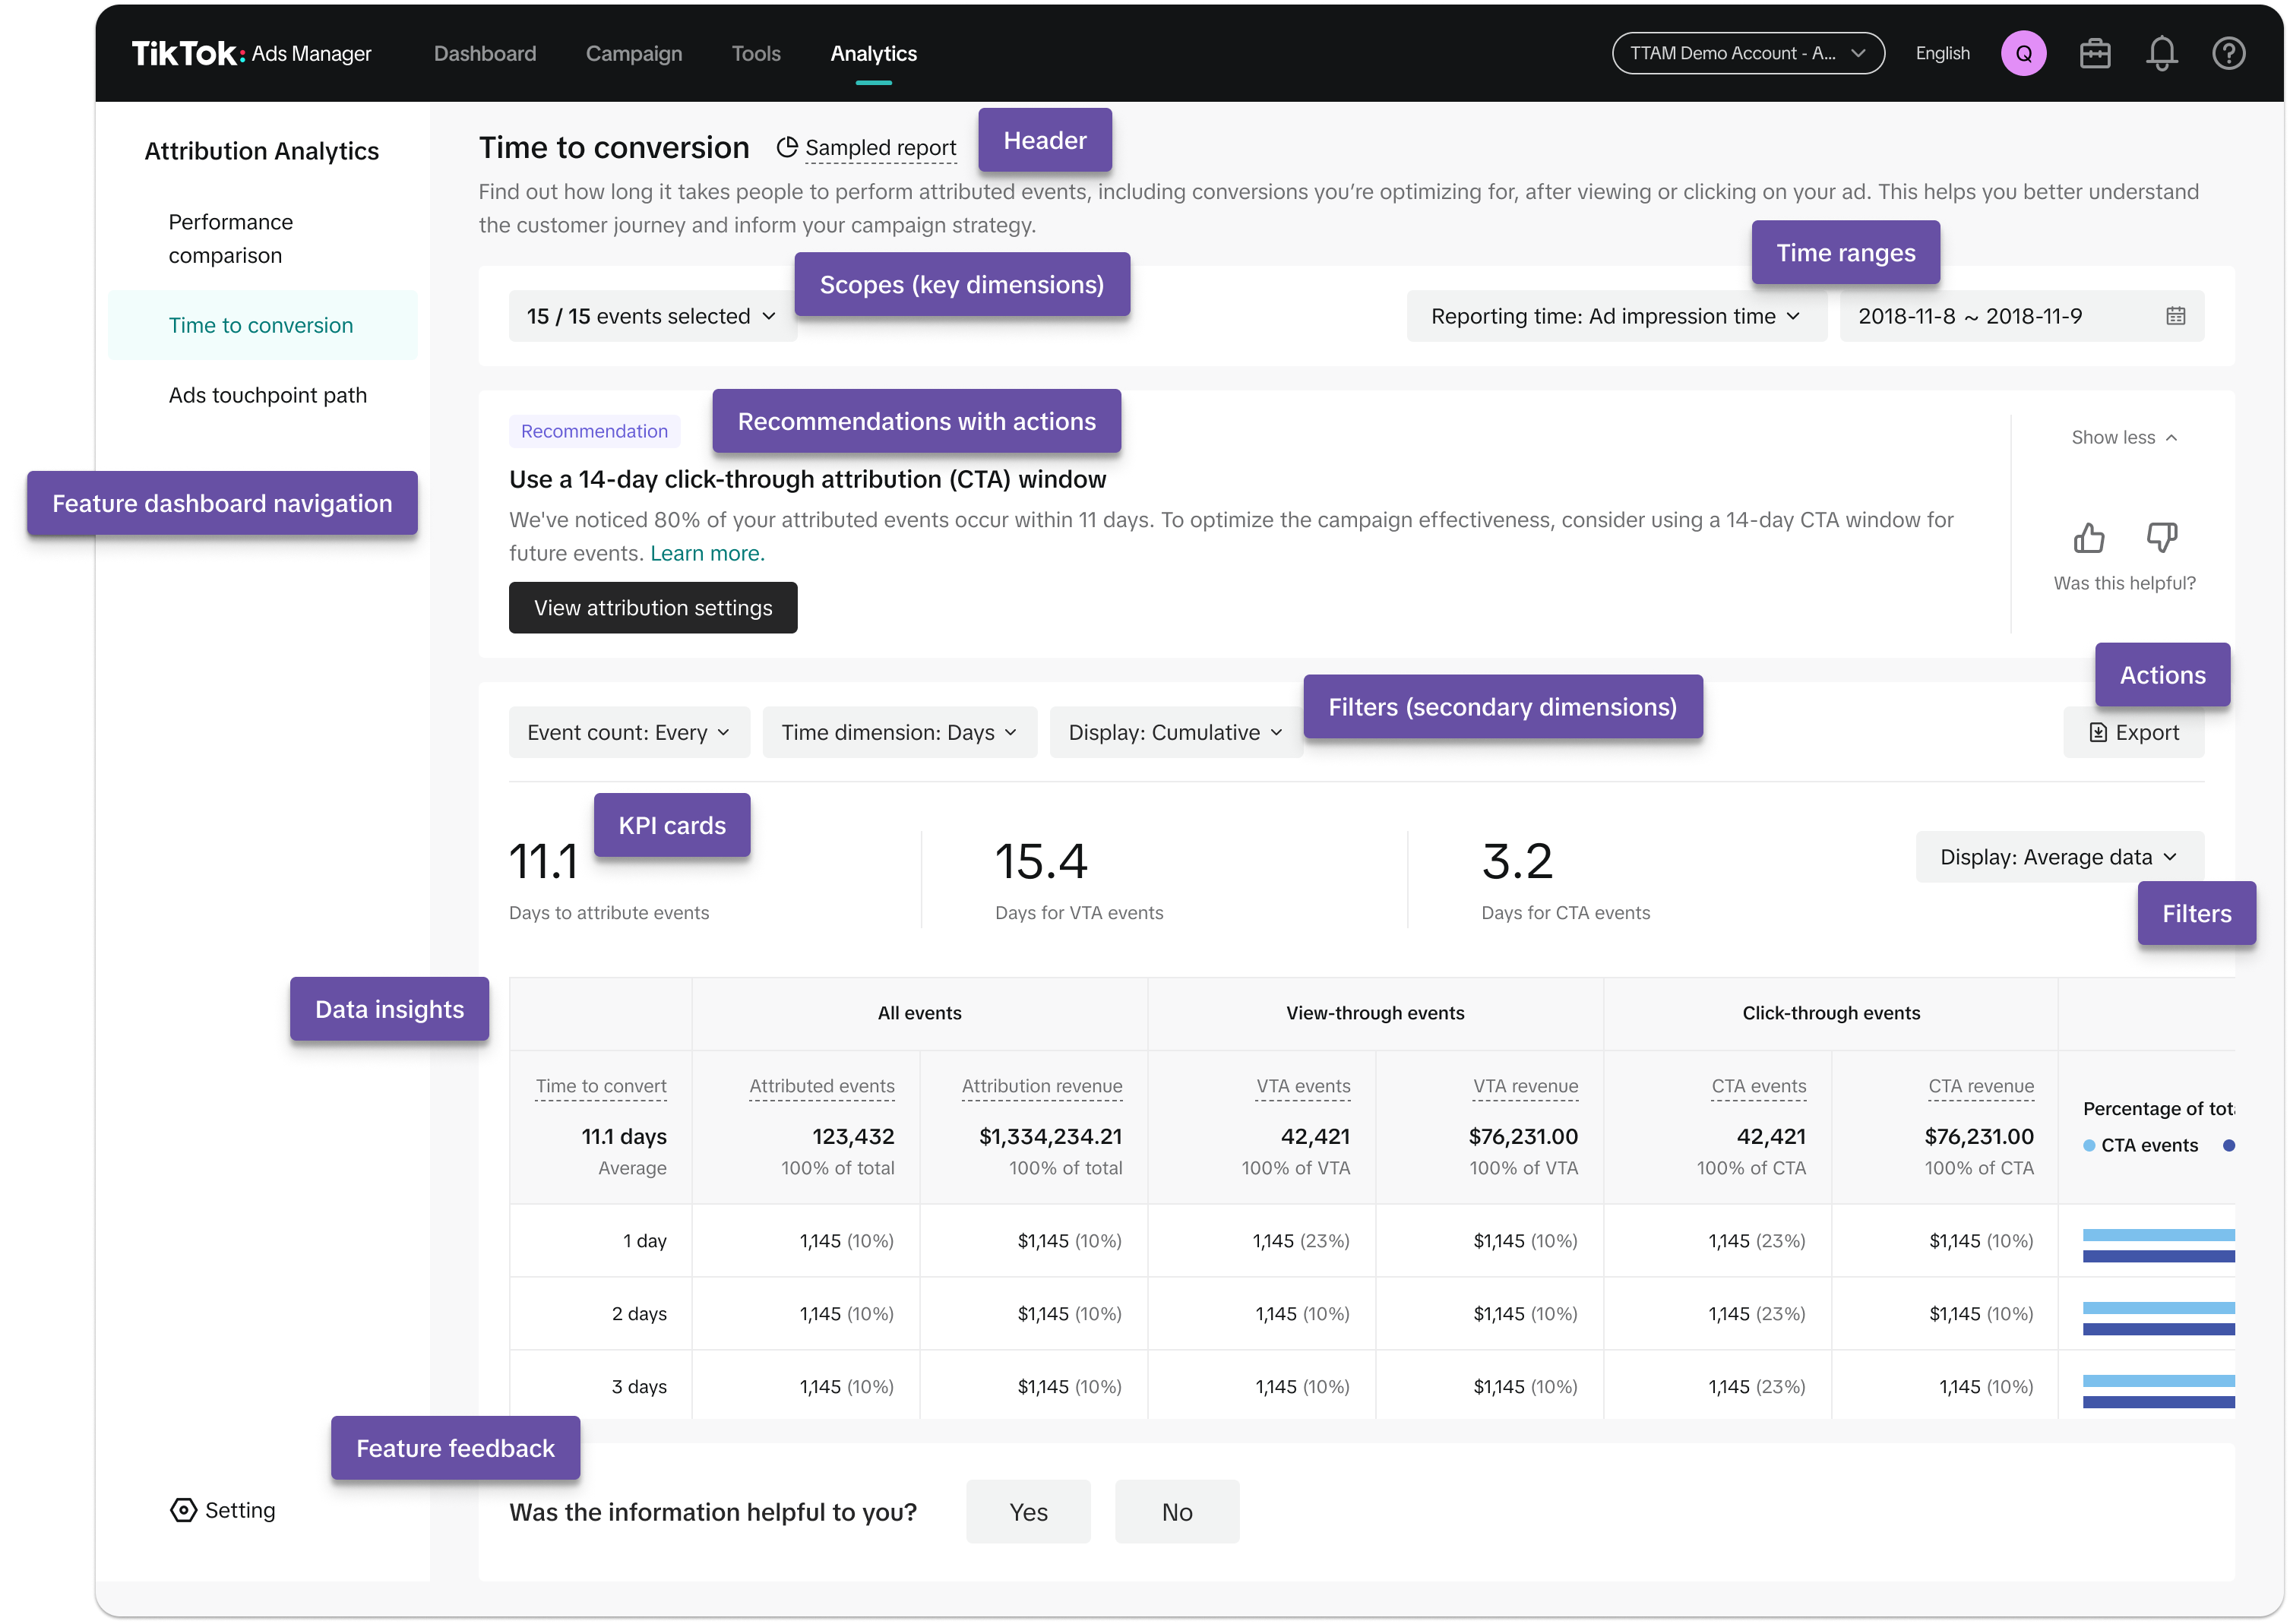
Information architecture & layout framework
I designed the overall product layout to organize features, dimensions, recommendations, data insights, customer feedback, and settings into a clear hierarchy. This reduced complexity, ensured consistency, and made data exploration intuitive.
Core features
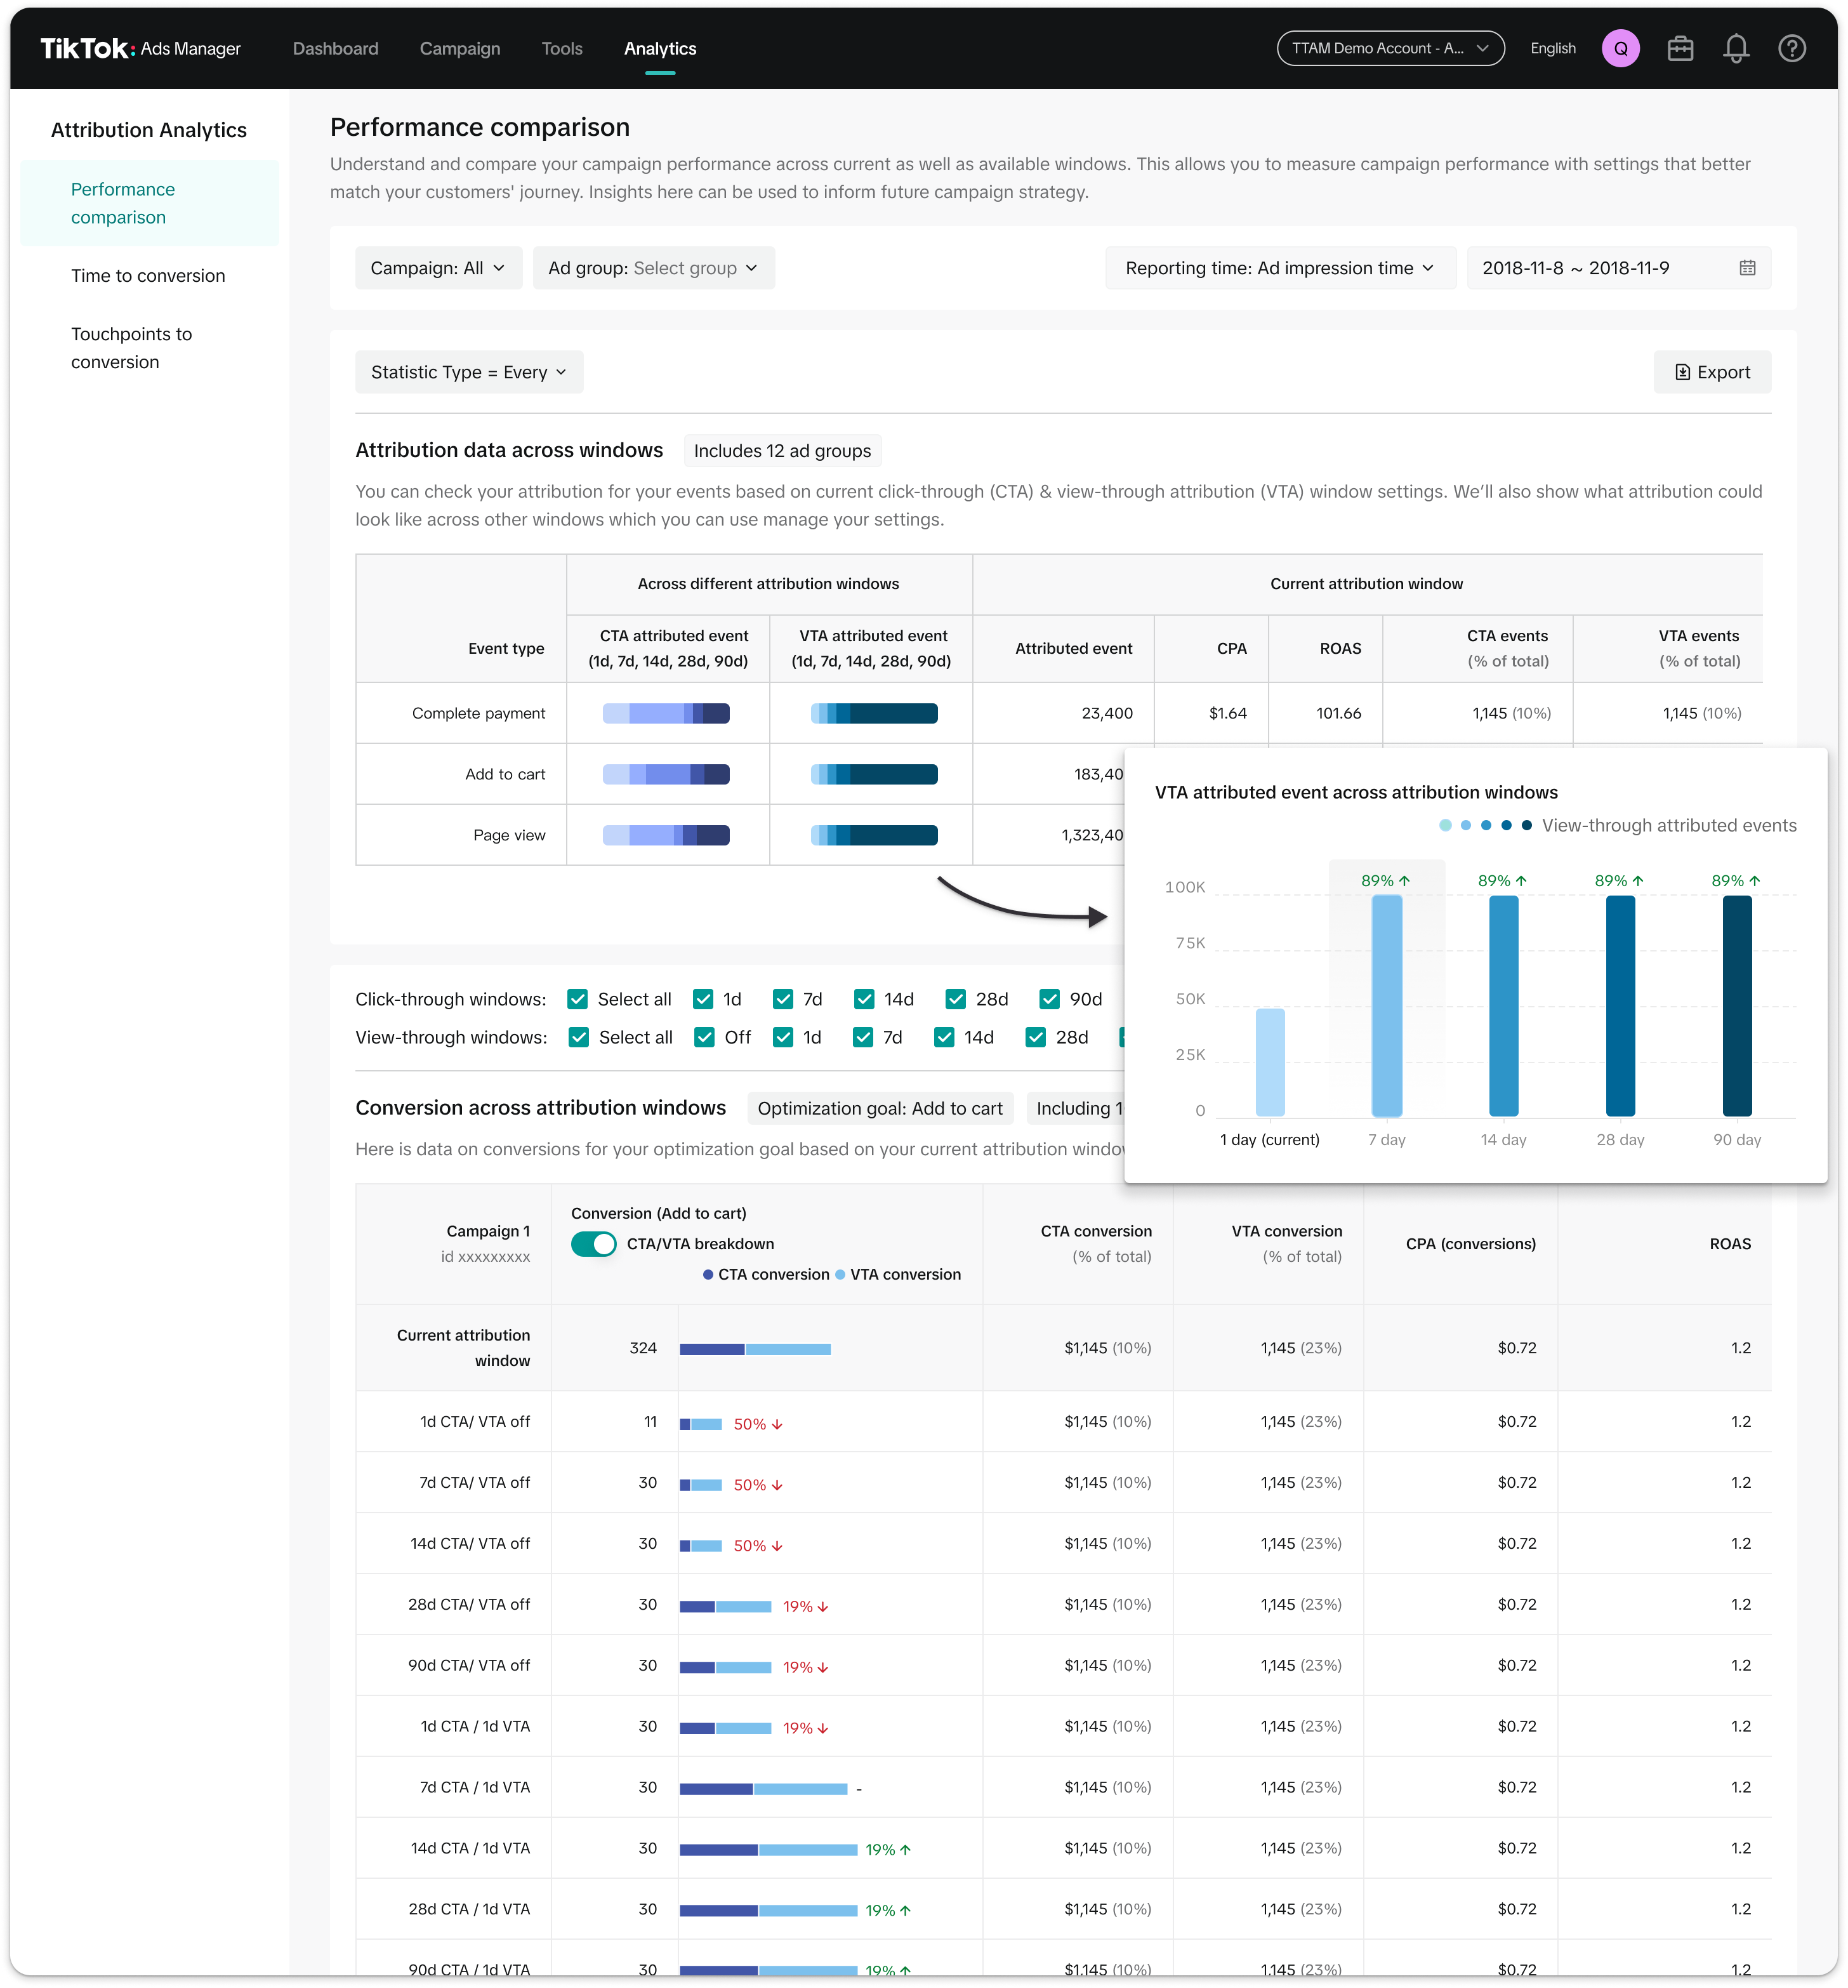
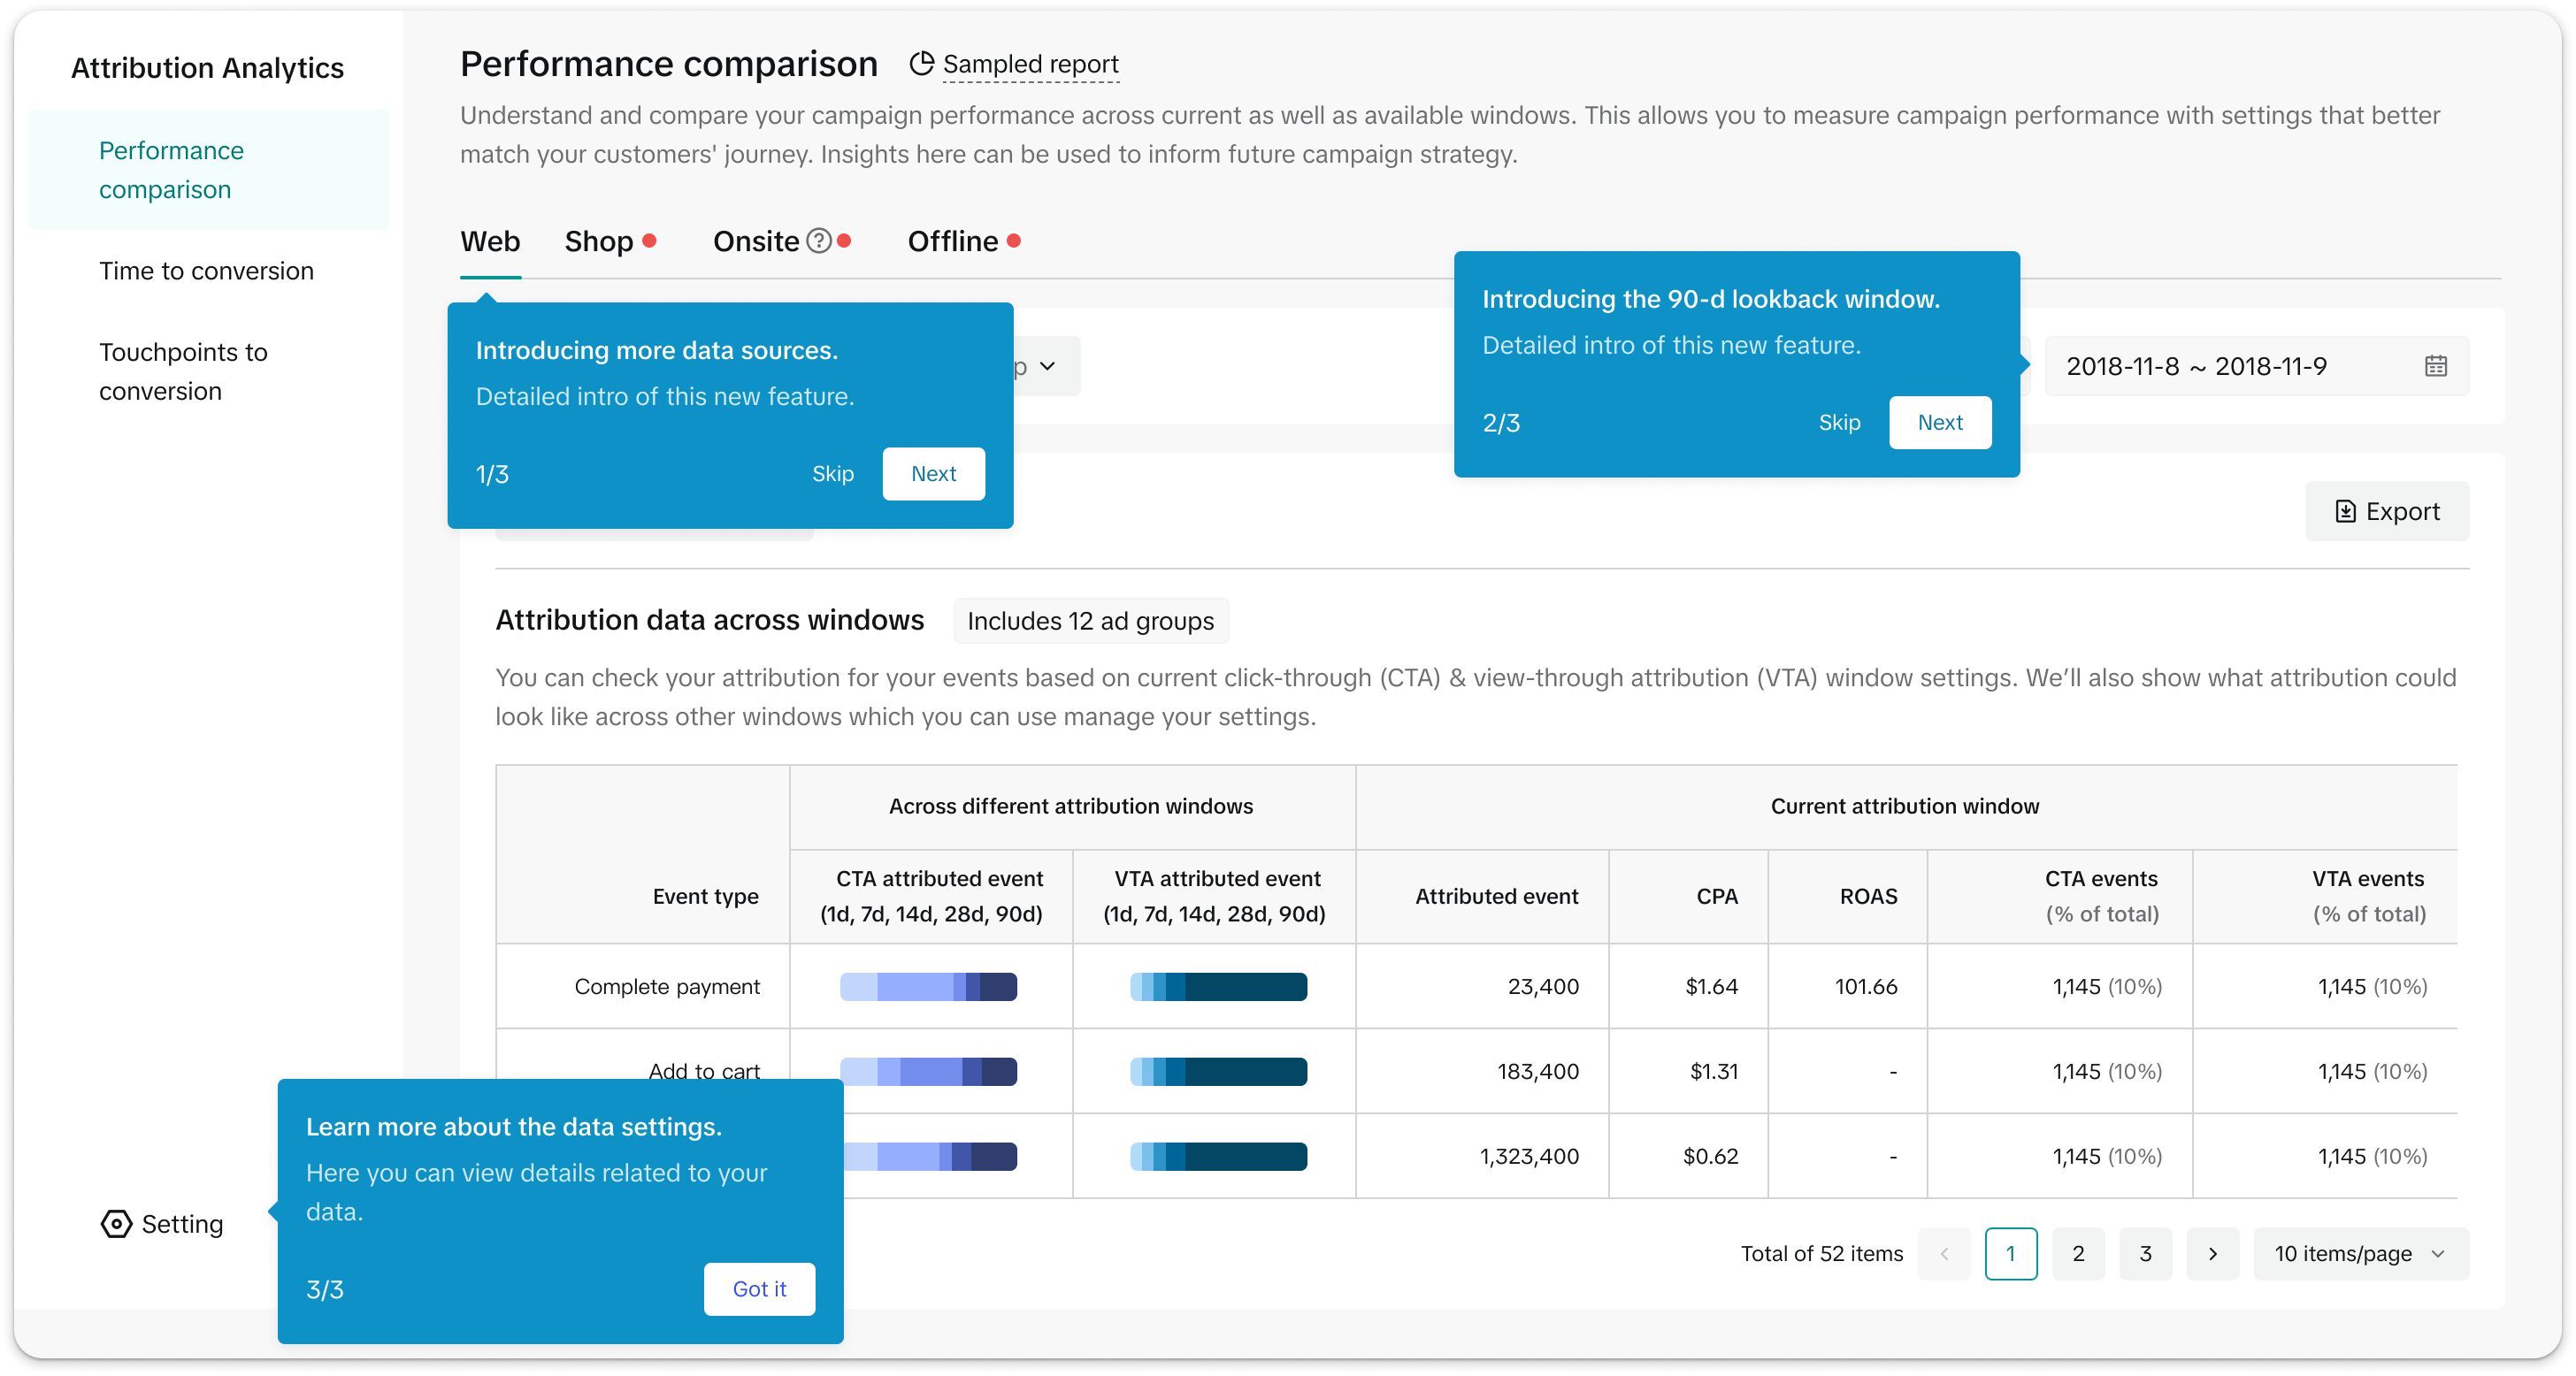
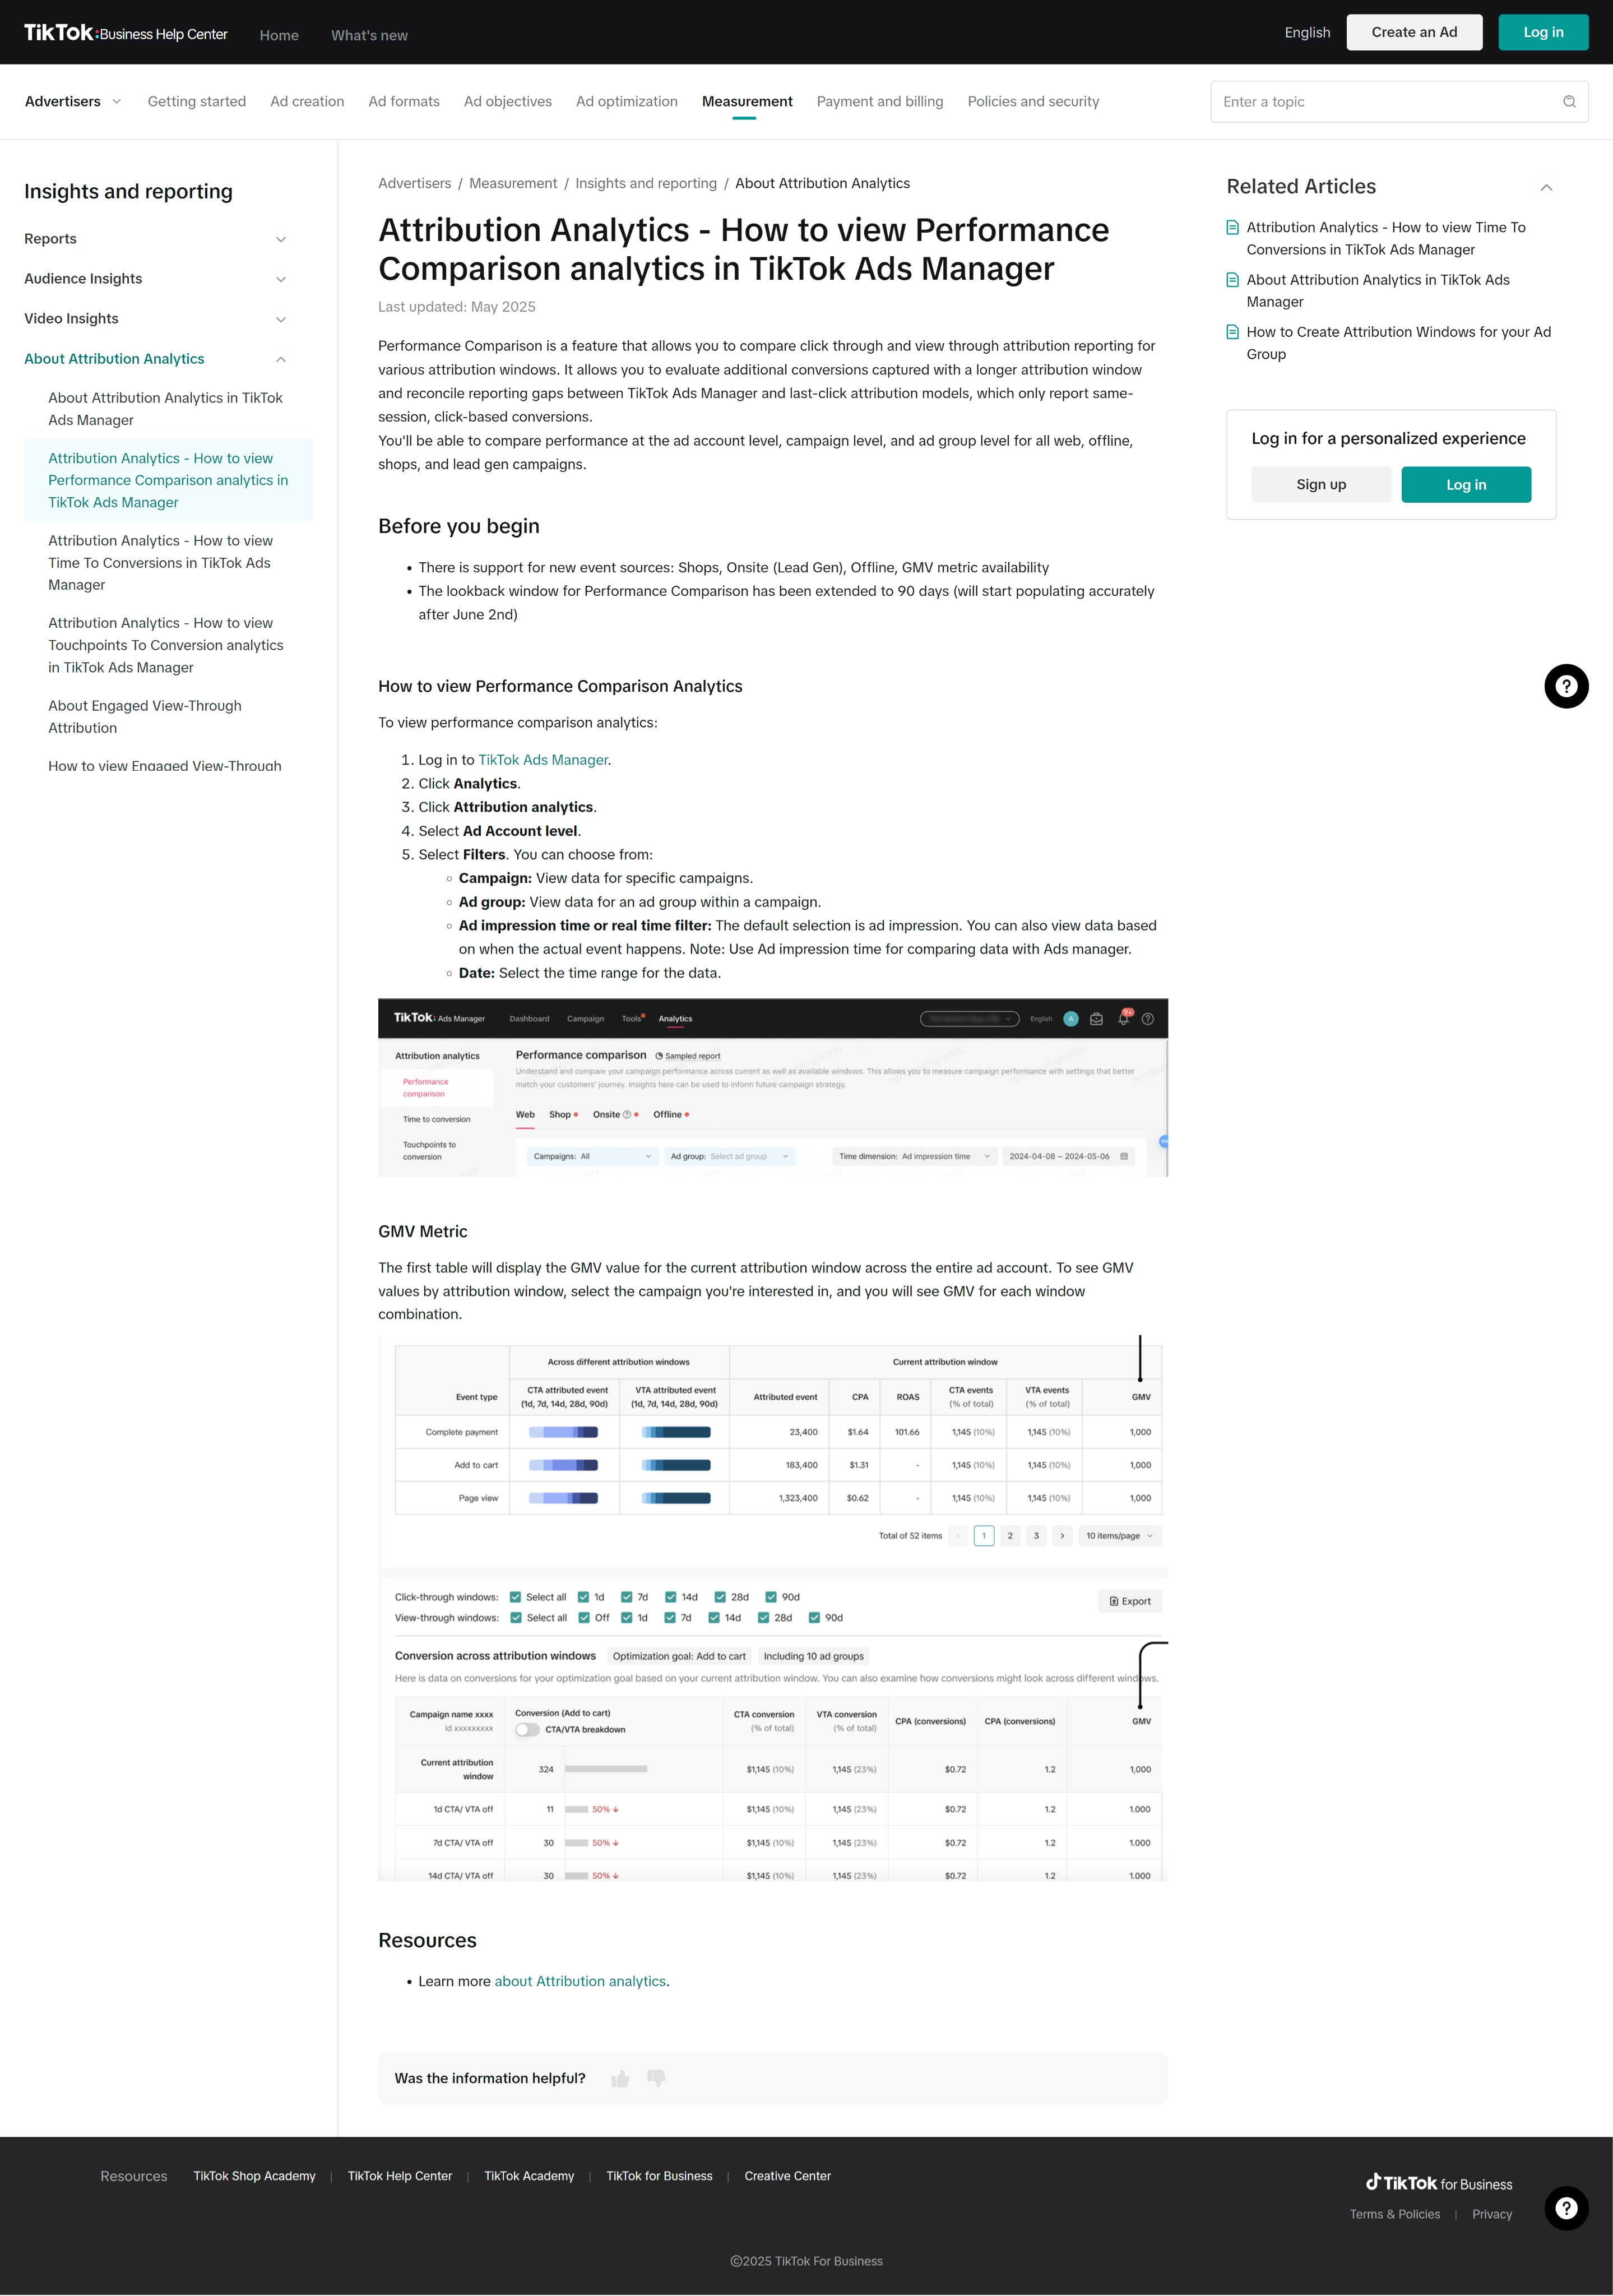
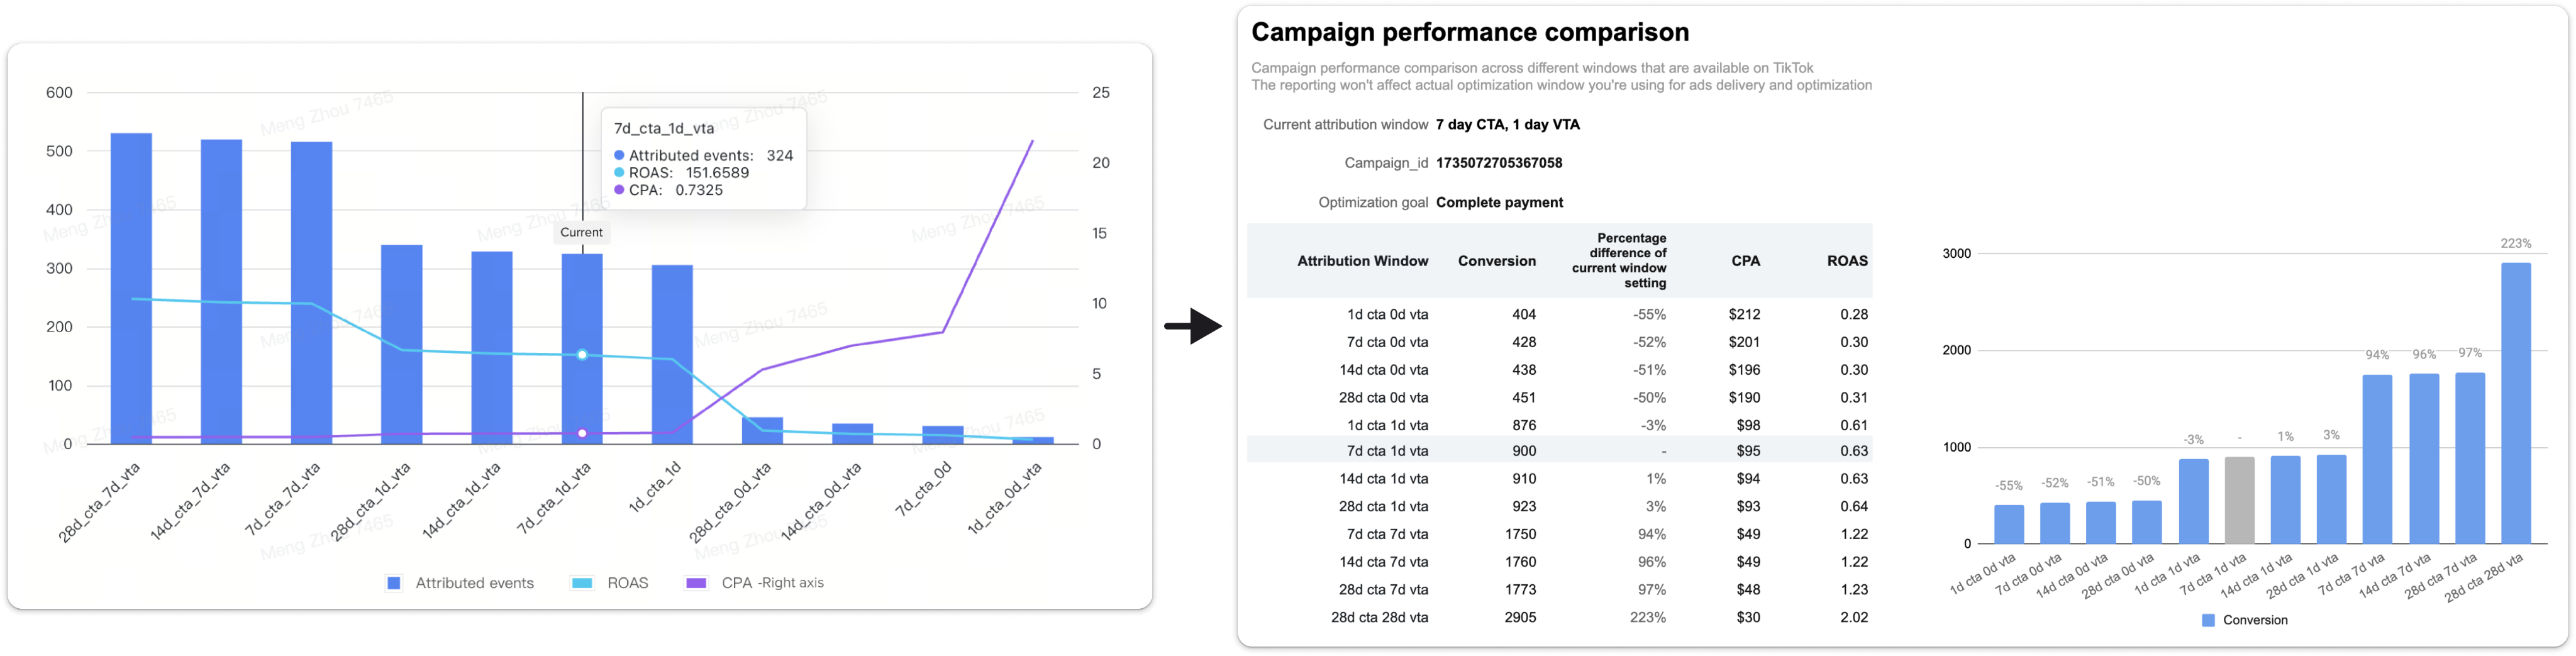
Performance Comparison (merged from two features):
Compare conversions across attribution windows, reveal click vs. view impact on KPIs (CPA, ROAS, Revenue).
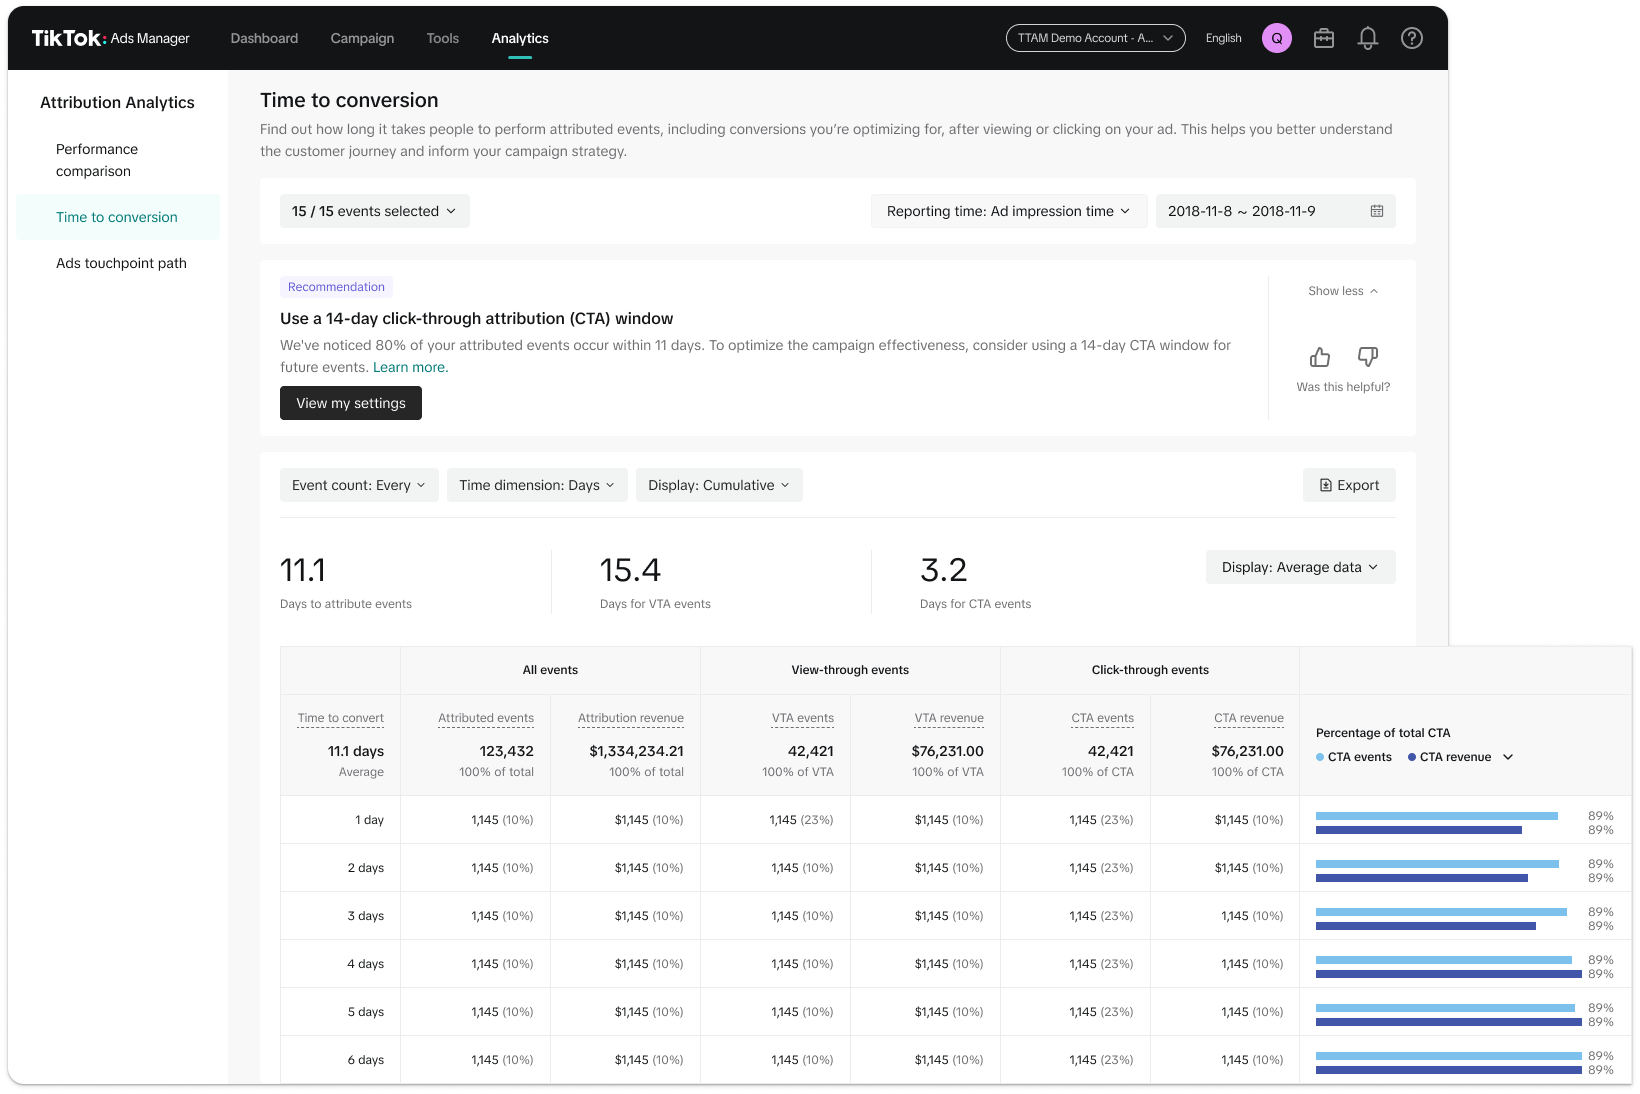
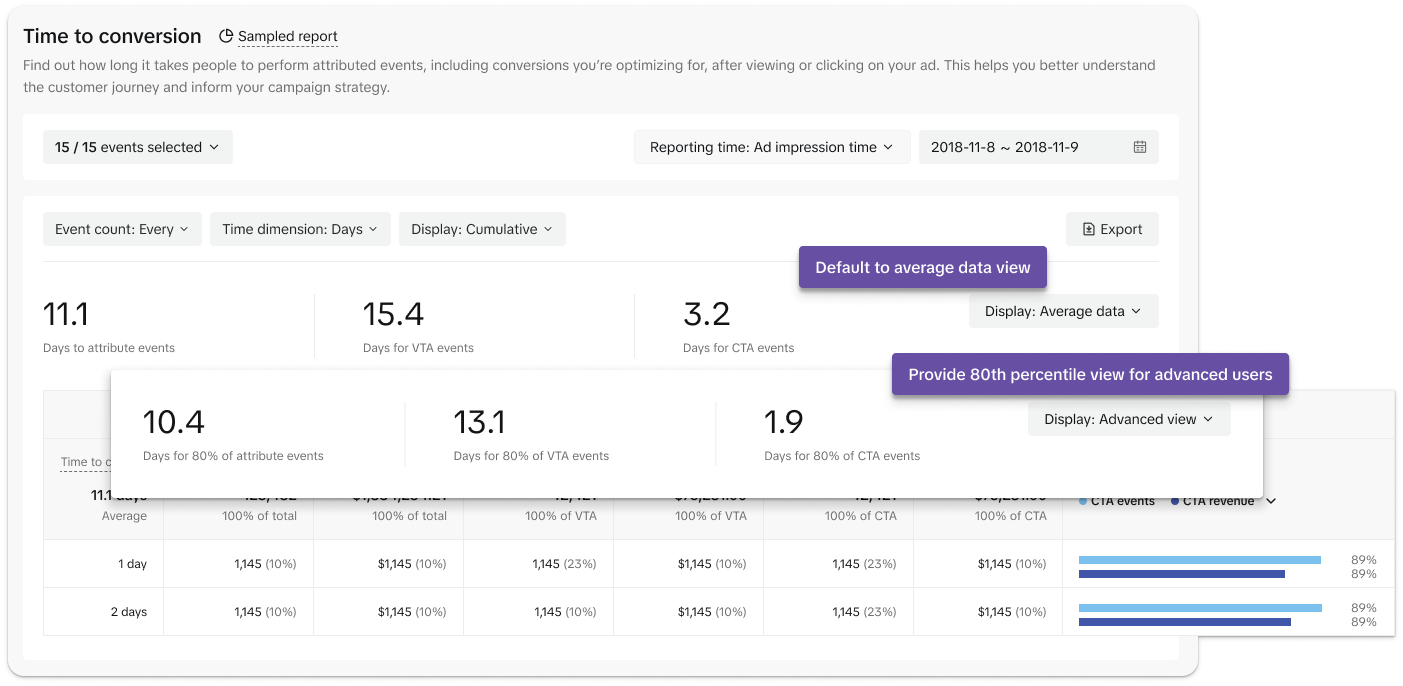
Time to Conversion:
Reveal consumer behavior patterns and conversion delays, and their impact on revenue, guiding advertisers in budget allocation and campaign timing.
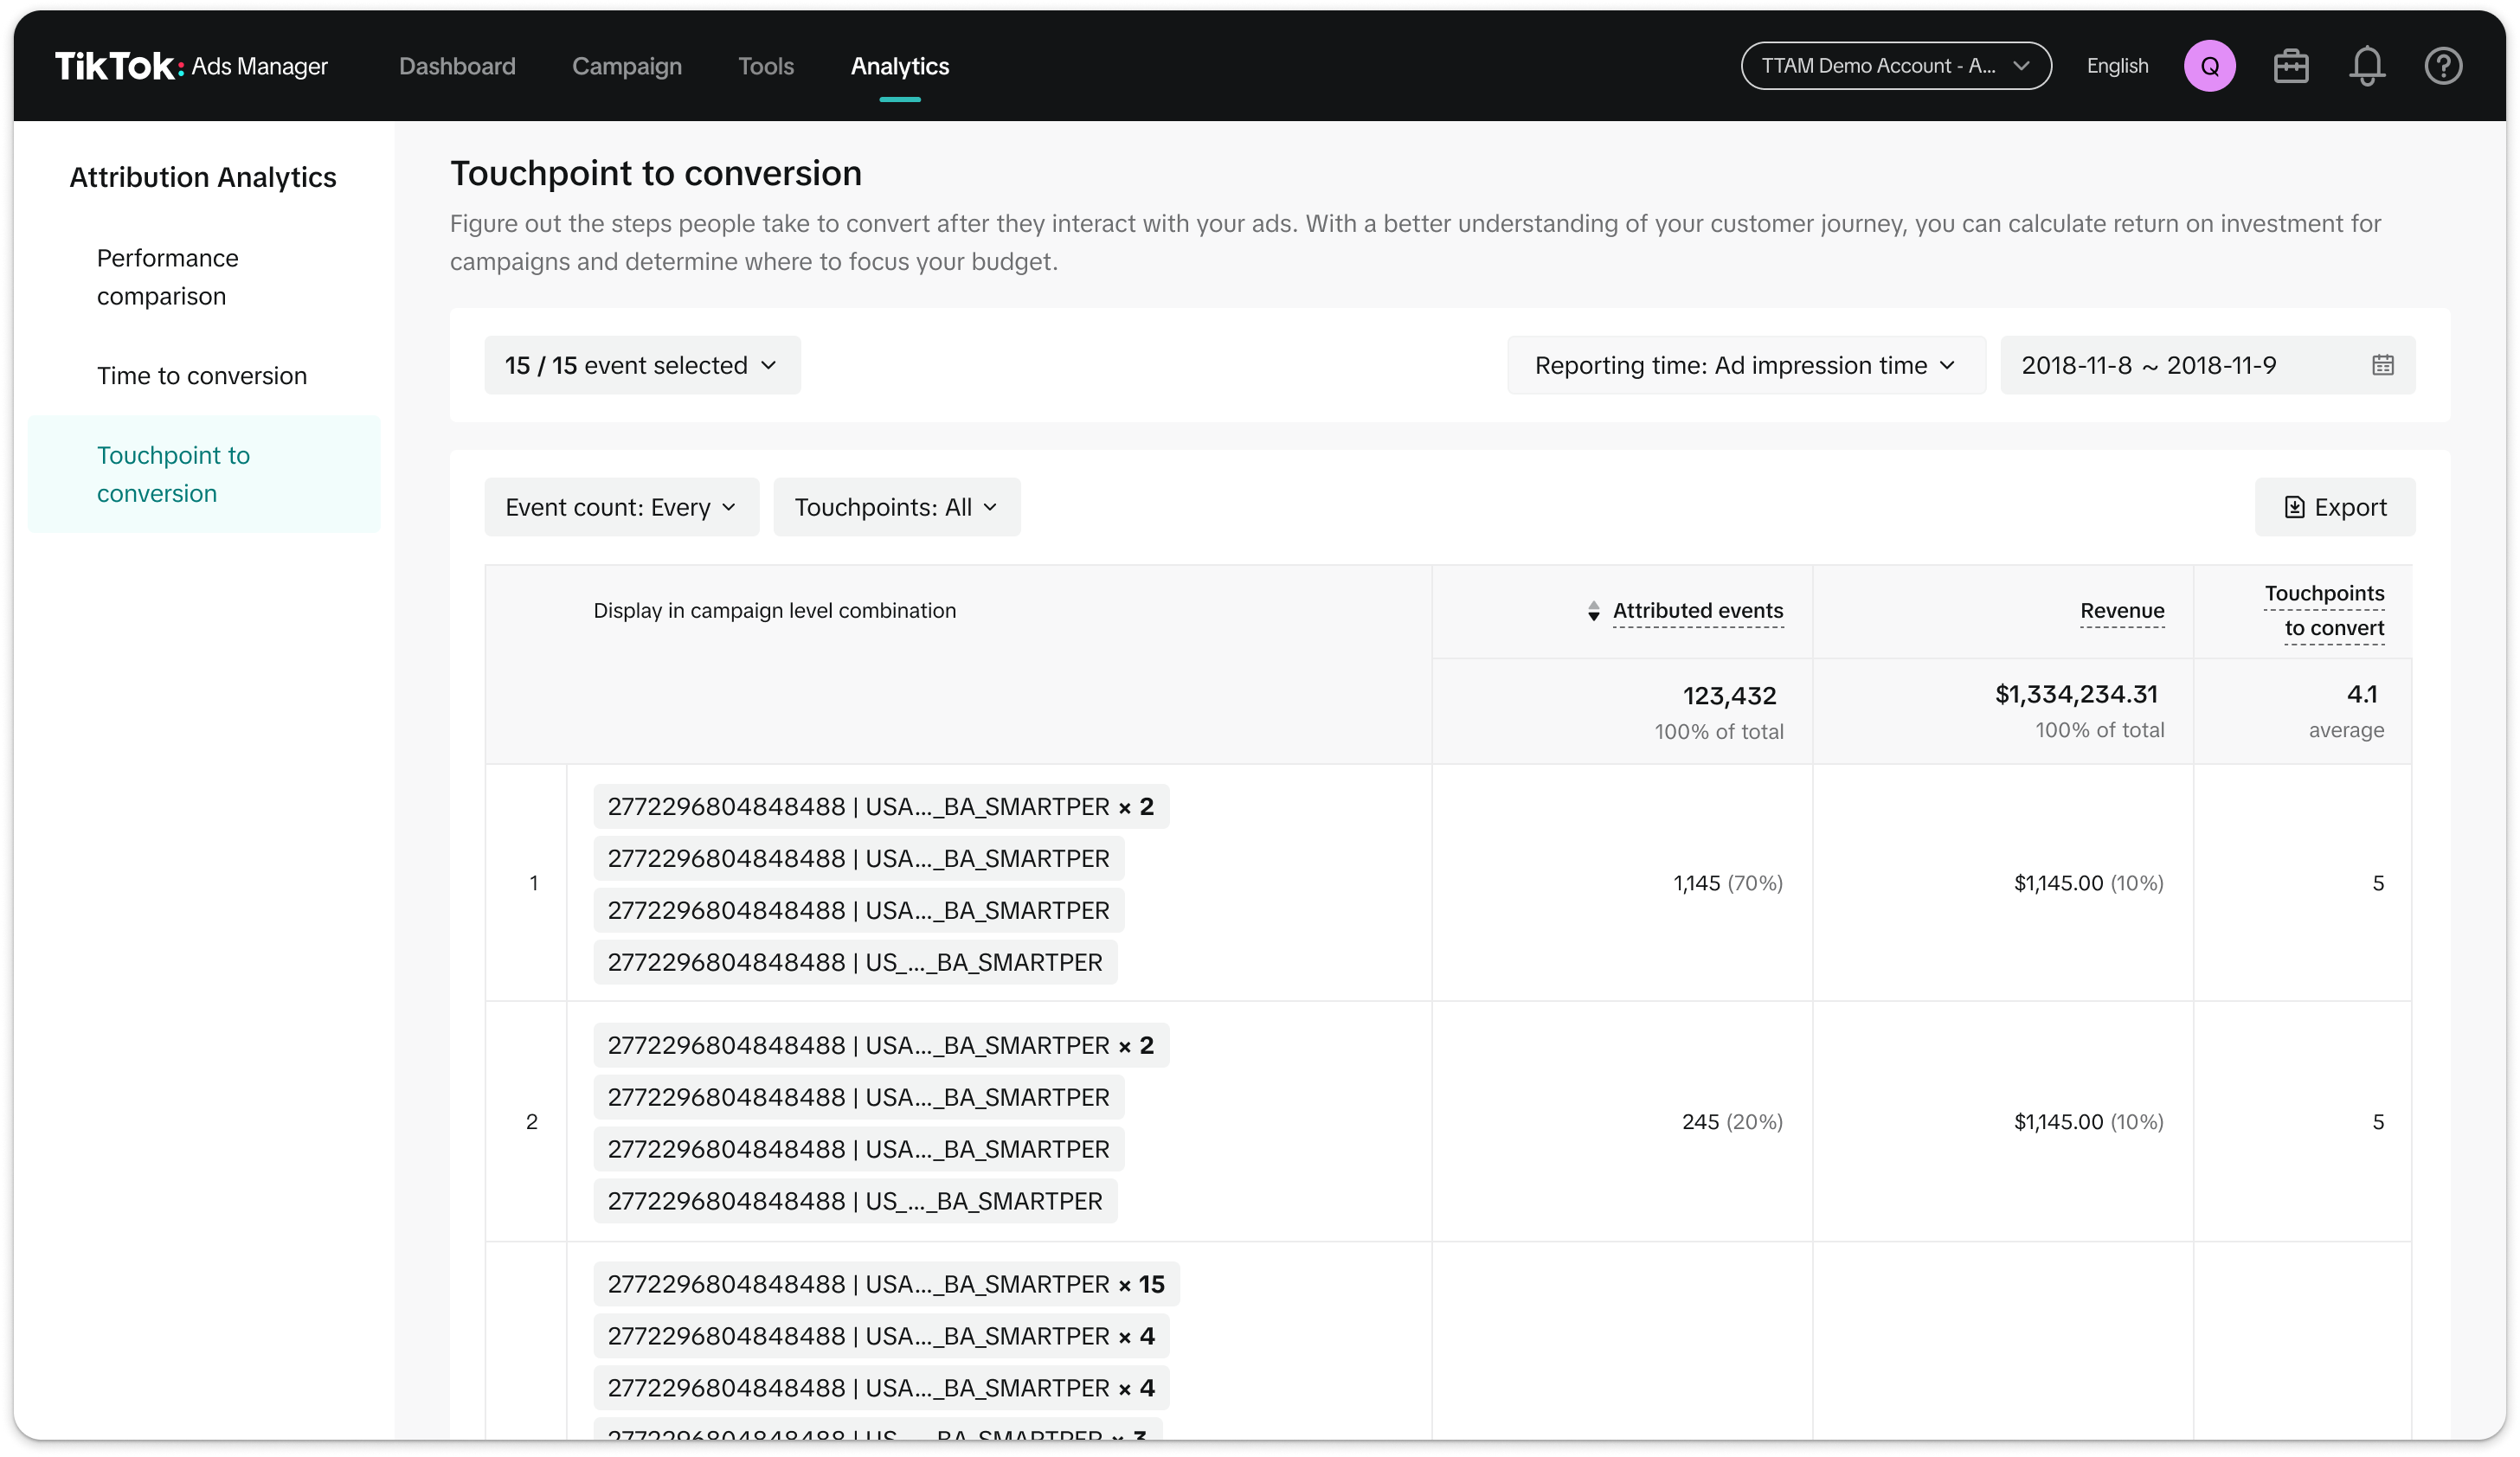
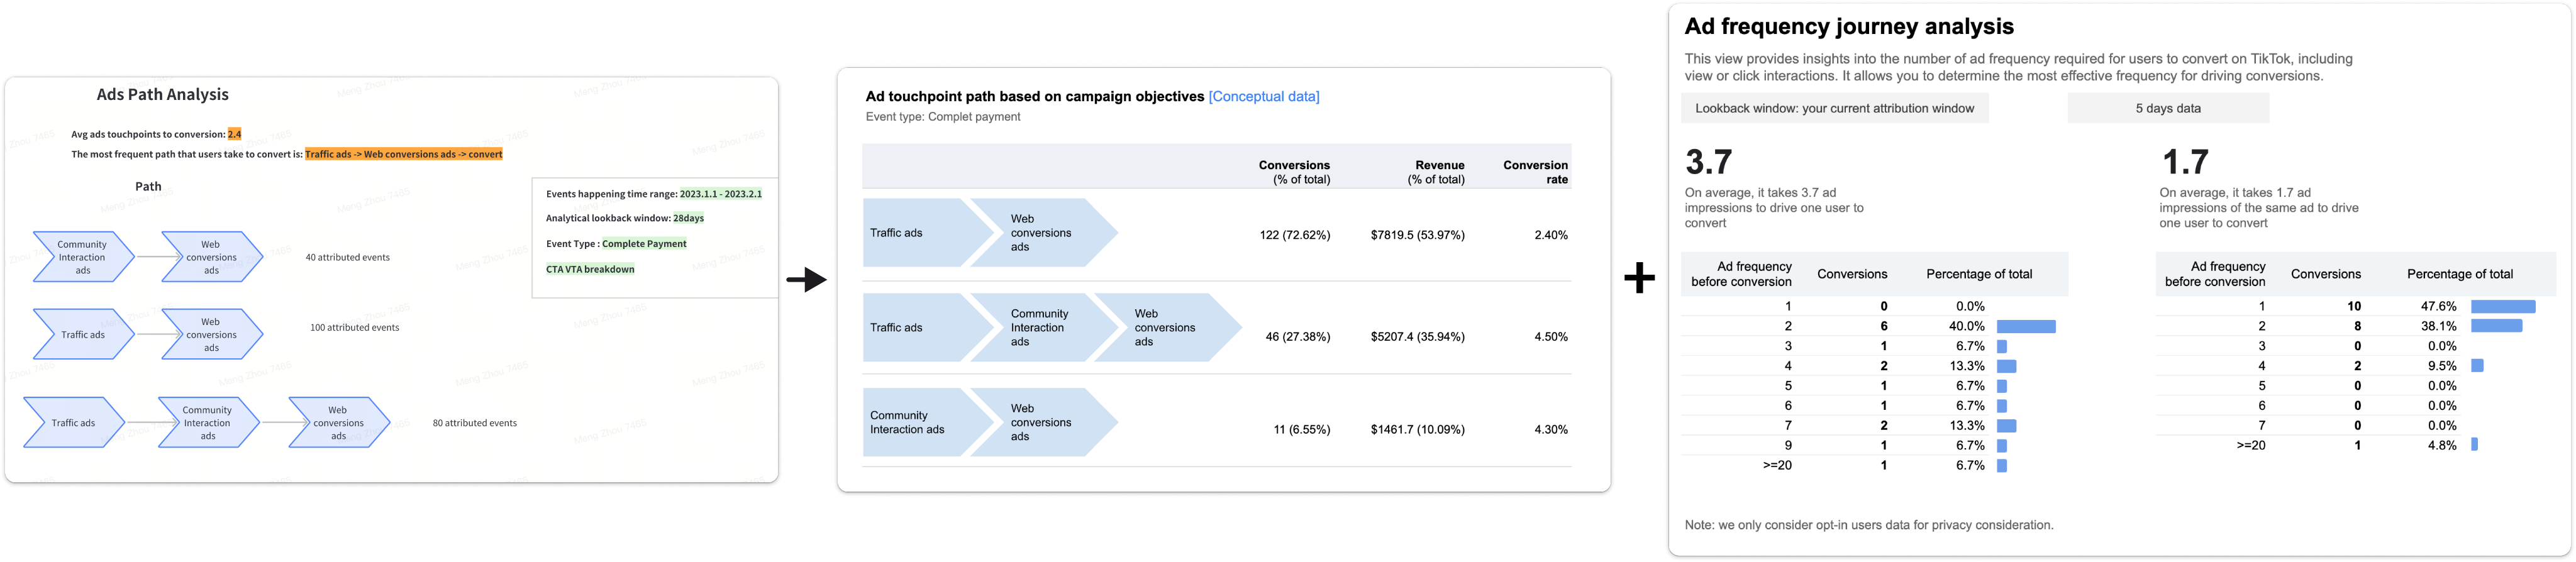
Touchpoints to Conversion:
Visualize full conversion paths and their impact on revenue, emphasizing TikTok’s role in multi-touch attribution.
Product education in GTM
Embedding education into GTM from in-product guidance to sales, internal training, and external comms, ensuring consistent narratives, clear education, and trusted and action-oriented communication.
Progressive disclosure to support advertisers with different levels of measurement sophistication
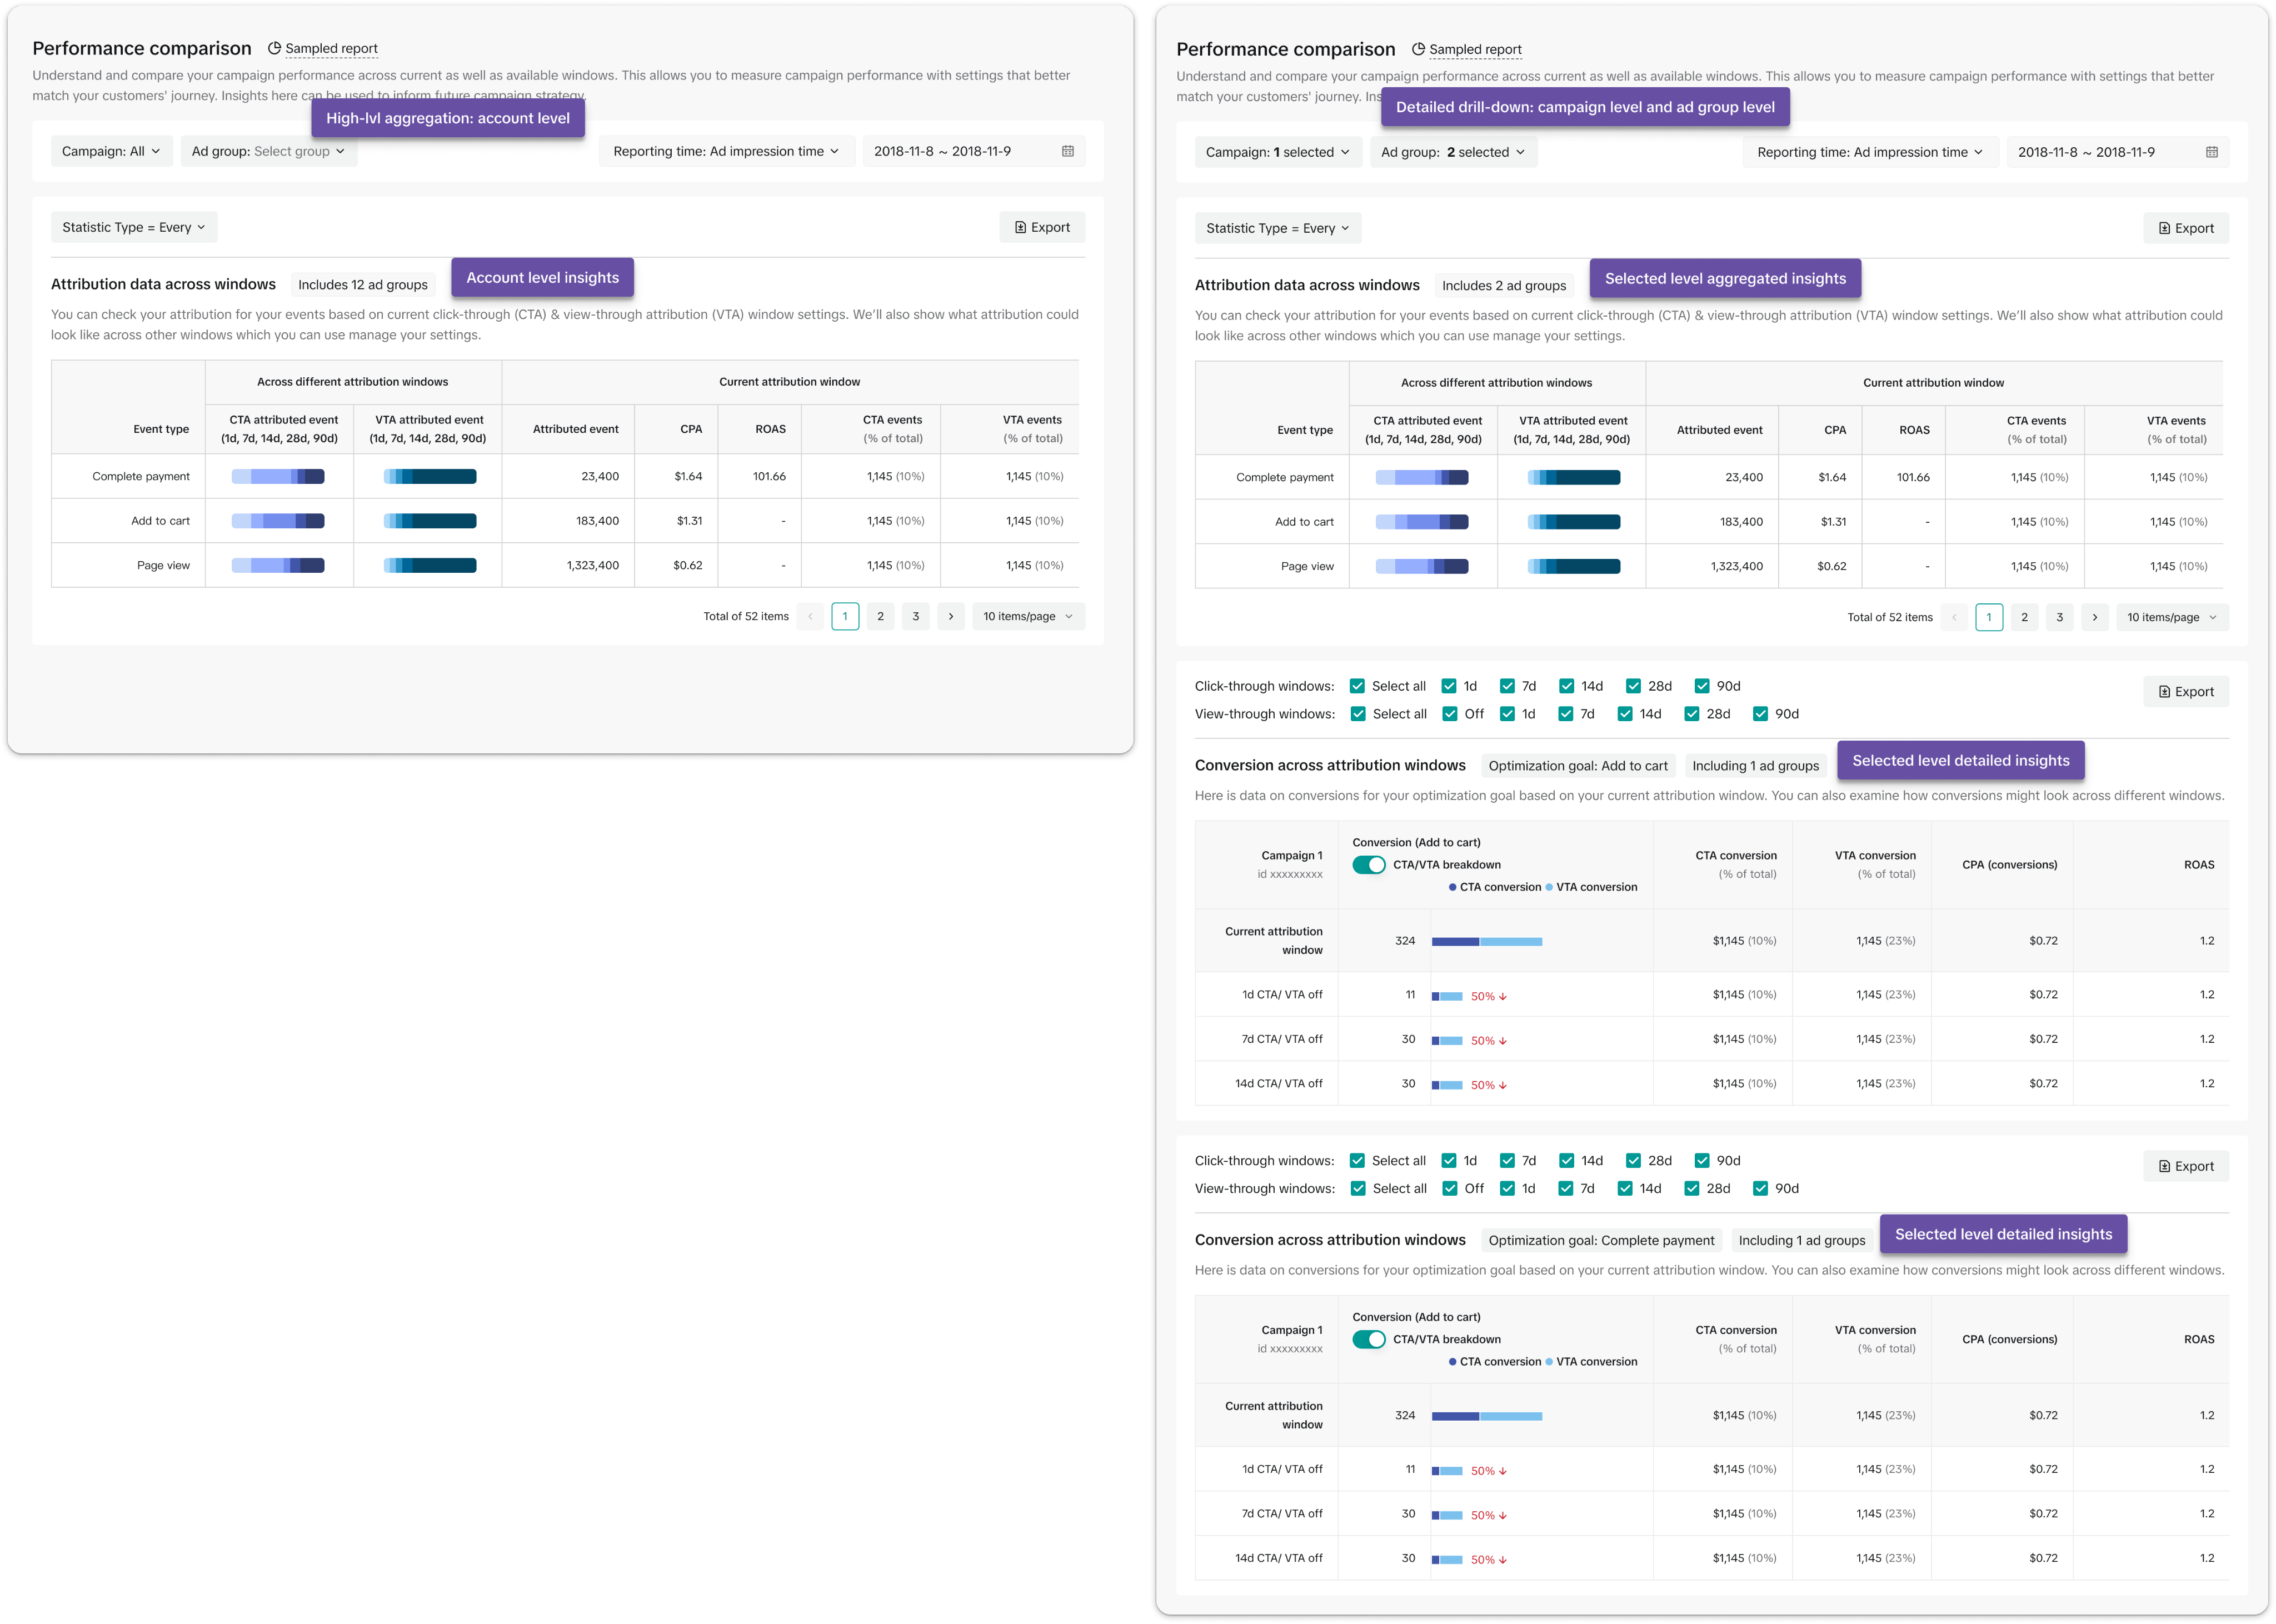
Defaulting dimensions and filters to the most valuable/commonly used views to reduce cognitive load
New feature interactive introductions to guide discovery and adoption
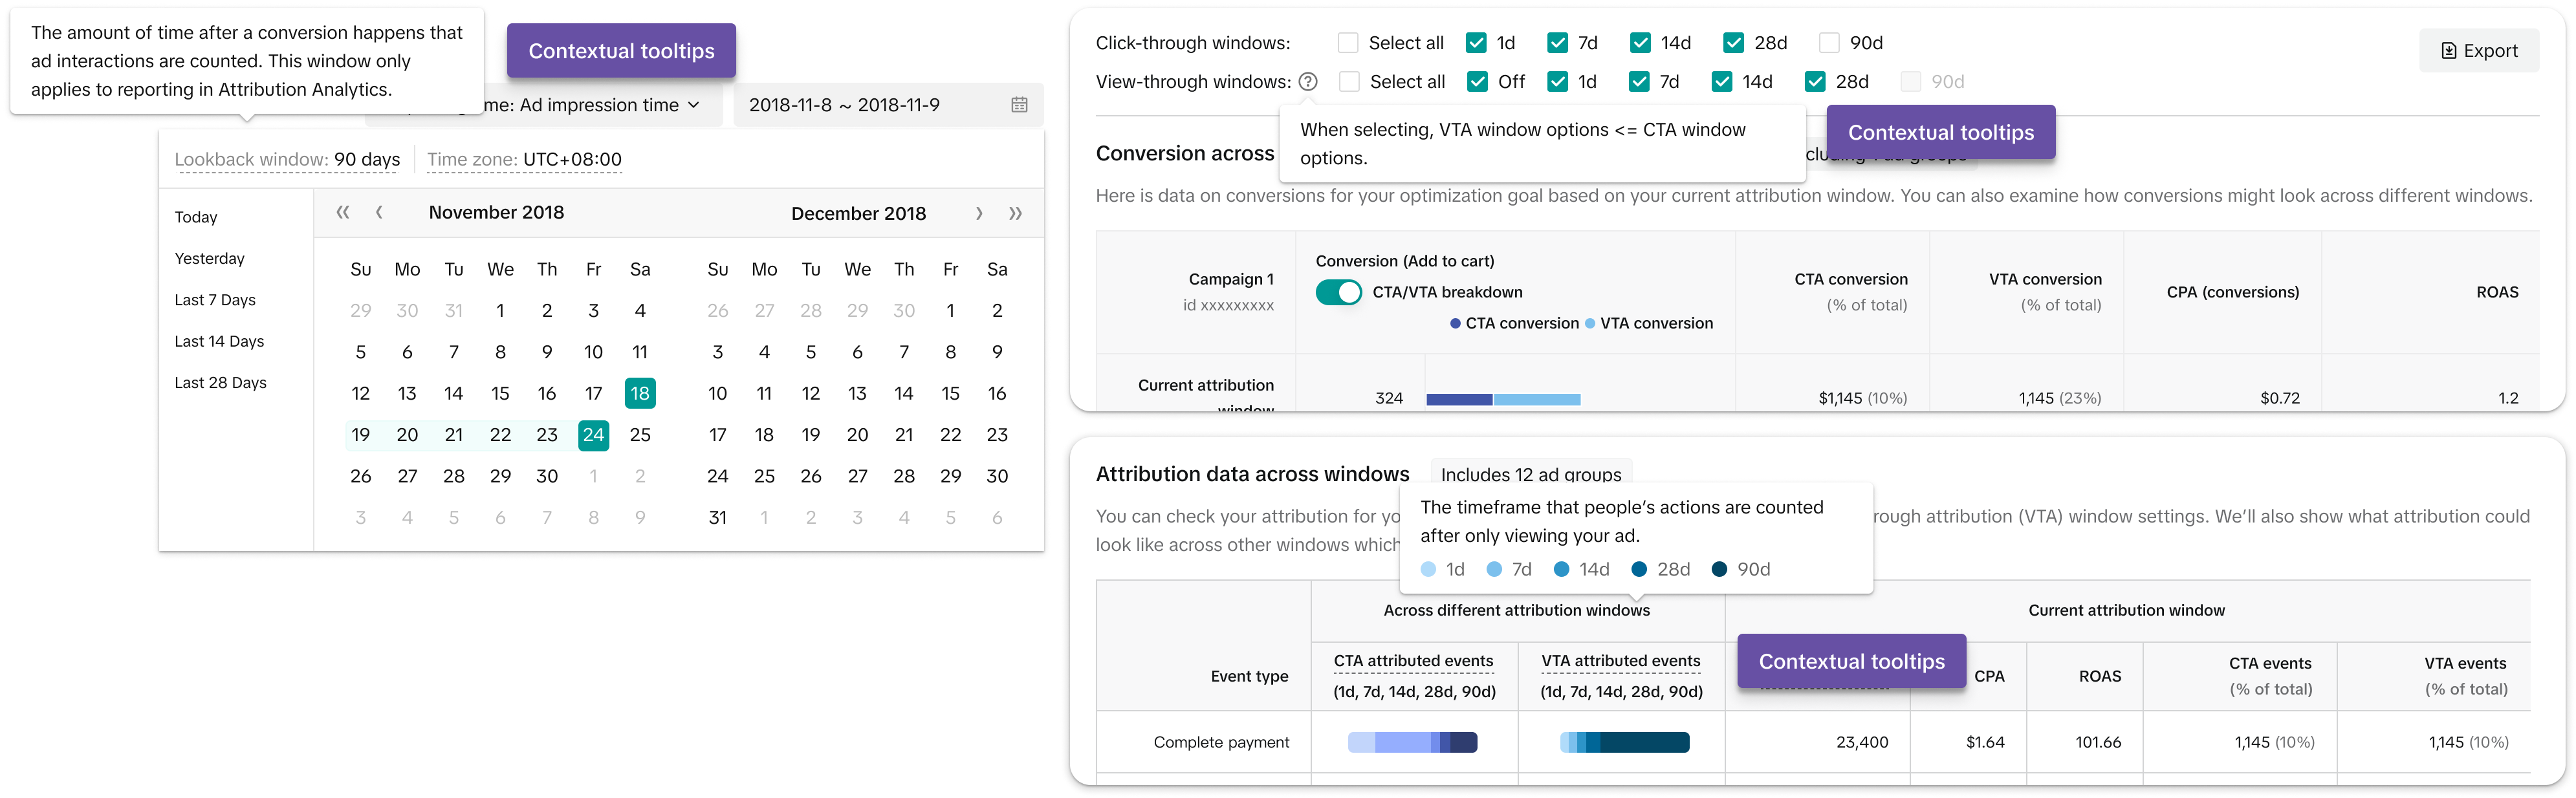
Contextual narratives explaining complex terms
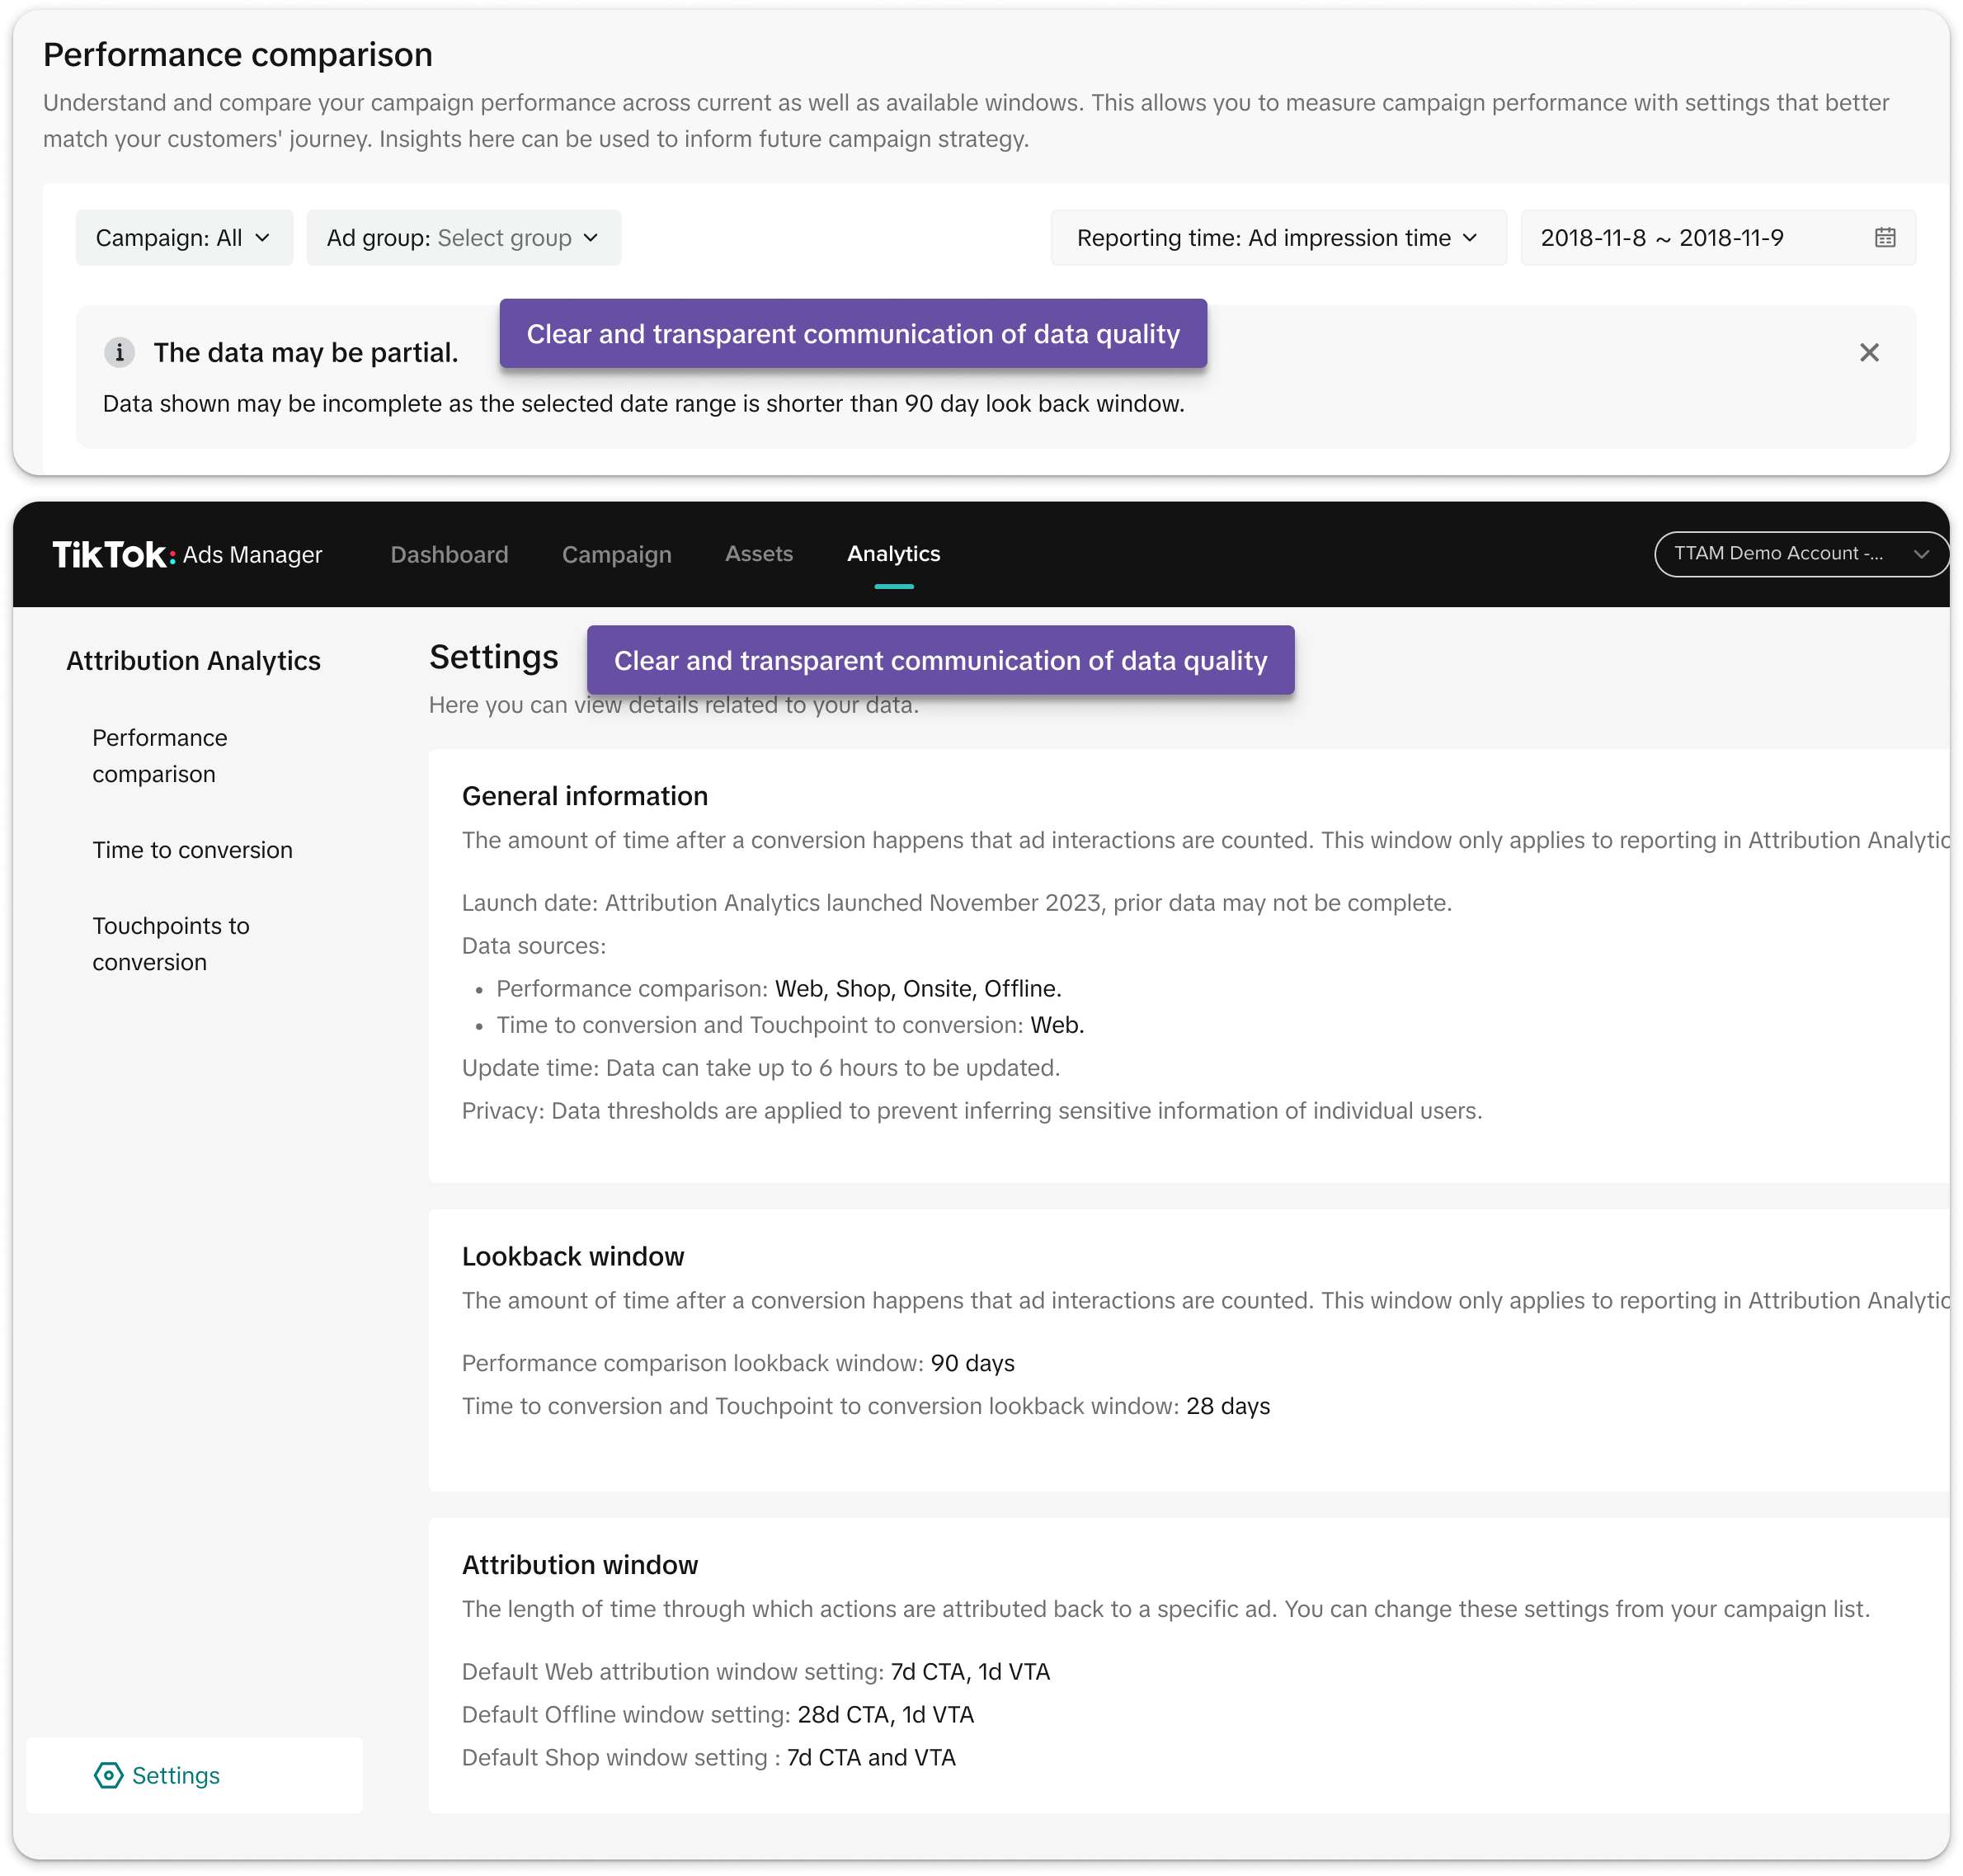
Clear and transparent communication of data coverage, accuracy, timeliness, quality risks, and privacy compliance
Internal training materials, Help Center updates, and PR content aligned with in-product experience
Internal measurement insights tool
In parallel, we launched an internal measurement insights tool with additional features, earning strong feedback from client-facing teams and advertisers for continued improvements.
Product/Market Fit
Market validation
- Post-MVP, market data validated product value:
- Revenue penetration: 59% KA, 62% MM, 26% SMB (vs. 20–40% typical for new products; >50% = mainstream adoption)
- Spend impact: +53% WoW for users vs. +28% non-users during BFCM (vs. 5–10% typical spend uplift).
- Revenue impact: ARPA +52% YoY for adopters vs. +22% non-users (vs. 10–20% benchmark uplift).
- Product education impact: NPS in global training improved from 48% to 84% (vs. +20 points benchmark = major success). Sales, client solutions, and measurement partner teams noted data insights were intuitive and actionable.
- Market feedback: Widely covered by industry press as a first-party solution addressing last-click limitations. Experts praised its richer conversion view while noting inherent first-party data limits.
“Having visibility into extra click-through and view-through event data has made it easier to prove TikTok's value and scale our clients' campaigns.” – Senior strategist, Power Digital Marketing

Scaling actionability
During user research, we found that many advertisers needed extra time to digest new attribution data and cross-check with other sources before making real-world decisions.
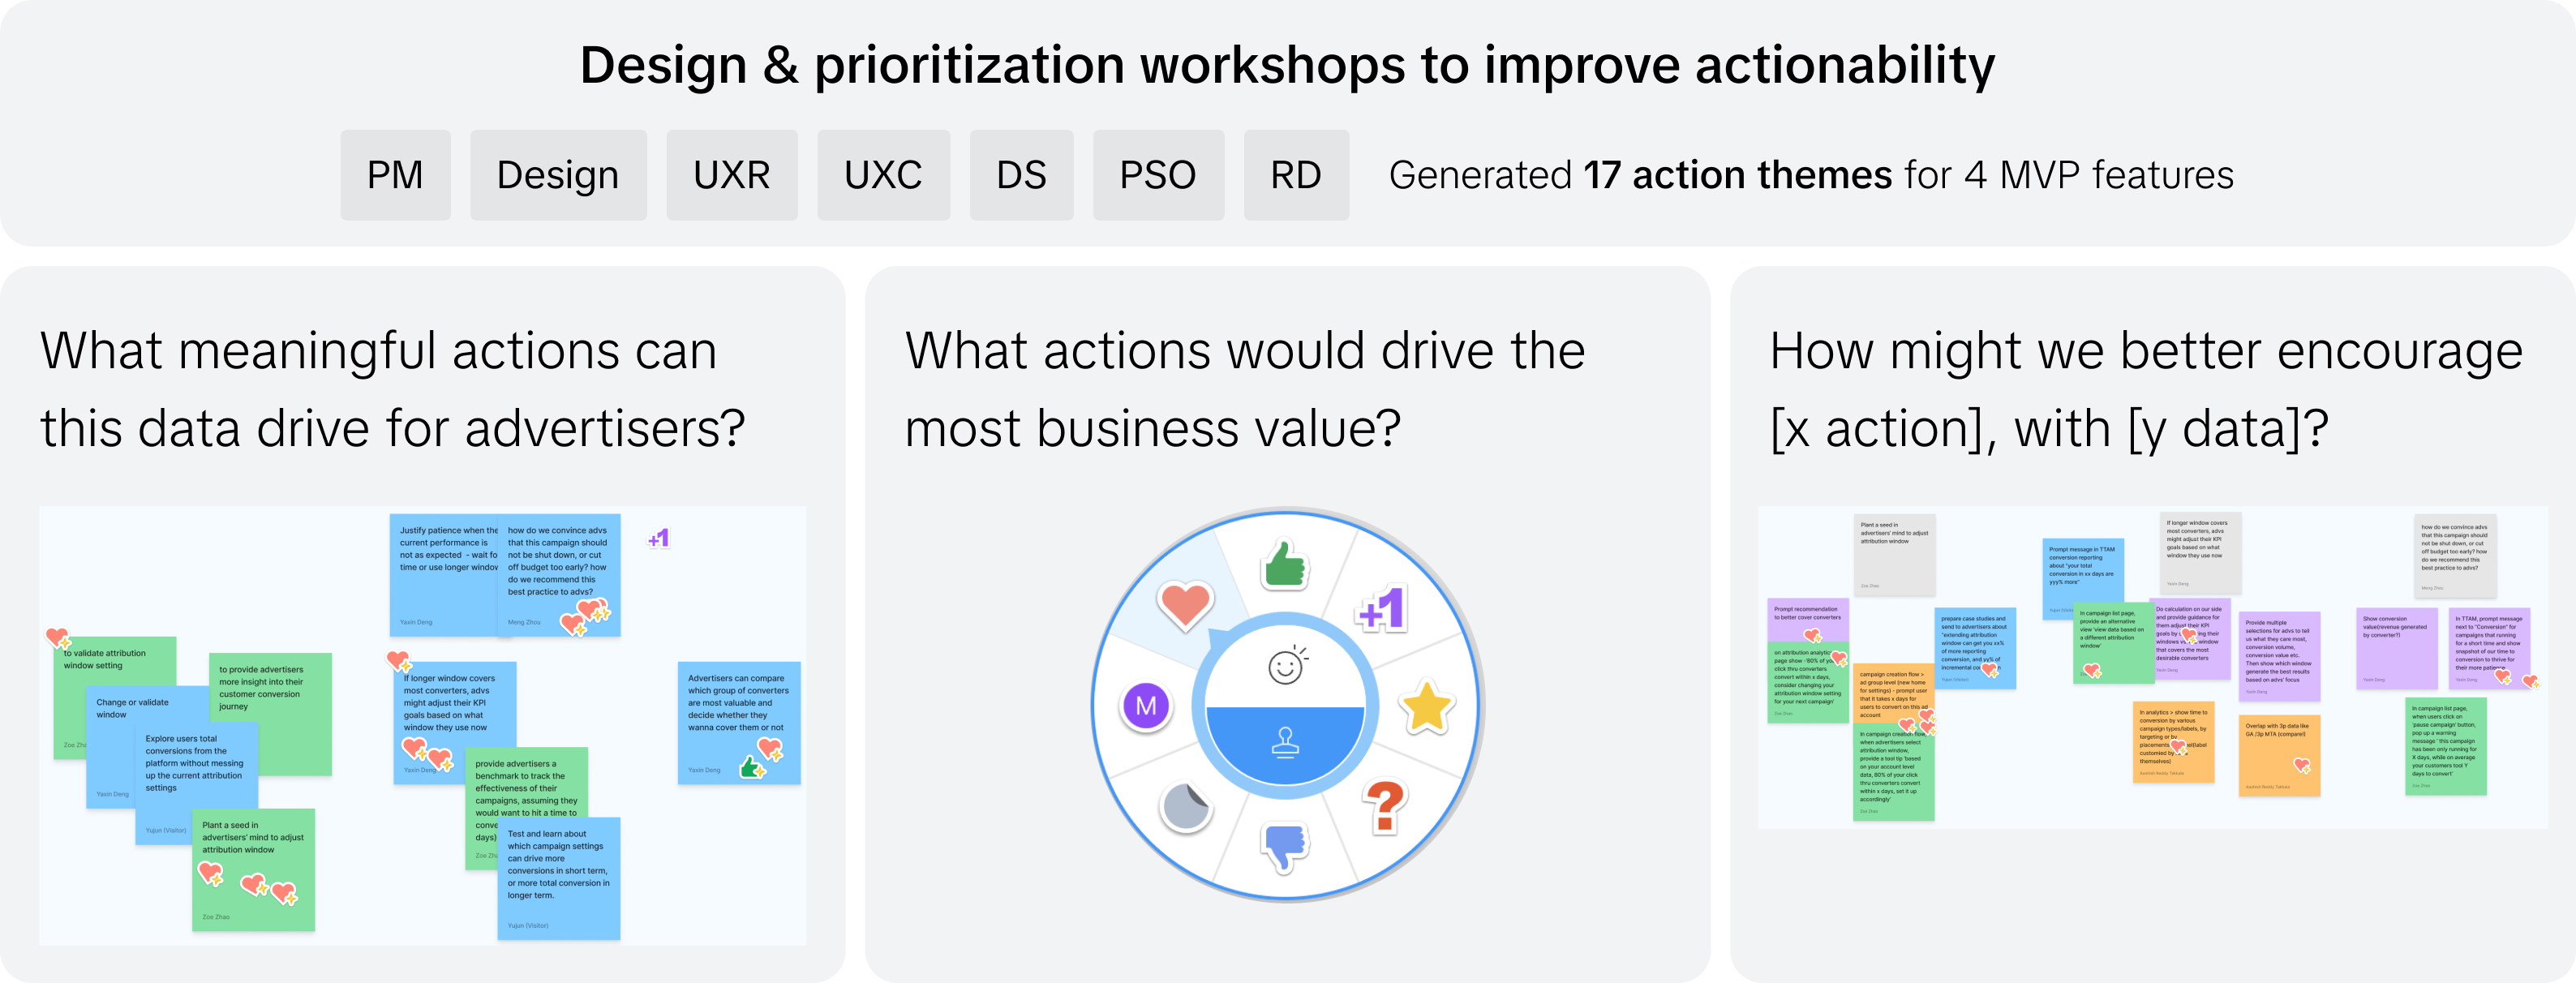
To address this chanllenge, I led a Design & Prioritization Workshop. Together, we generated 17 actionable themes across the four MVP features, all aimed at encouraging advertisers to act confidently on data insights.
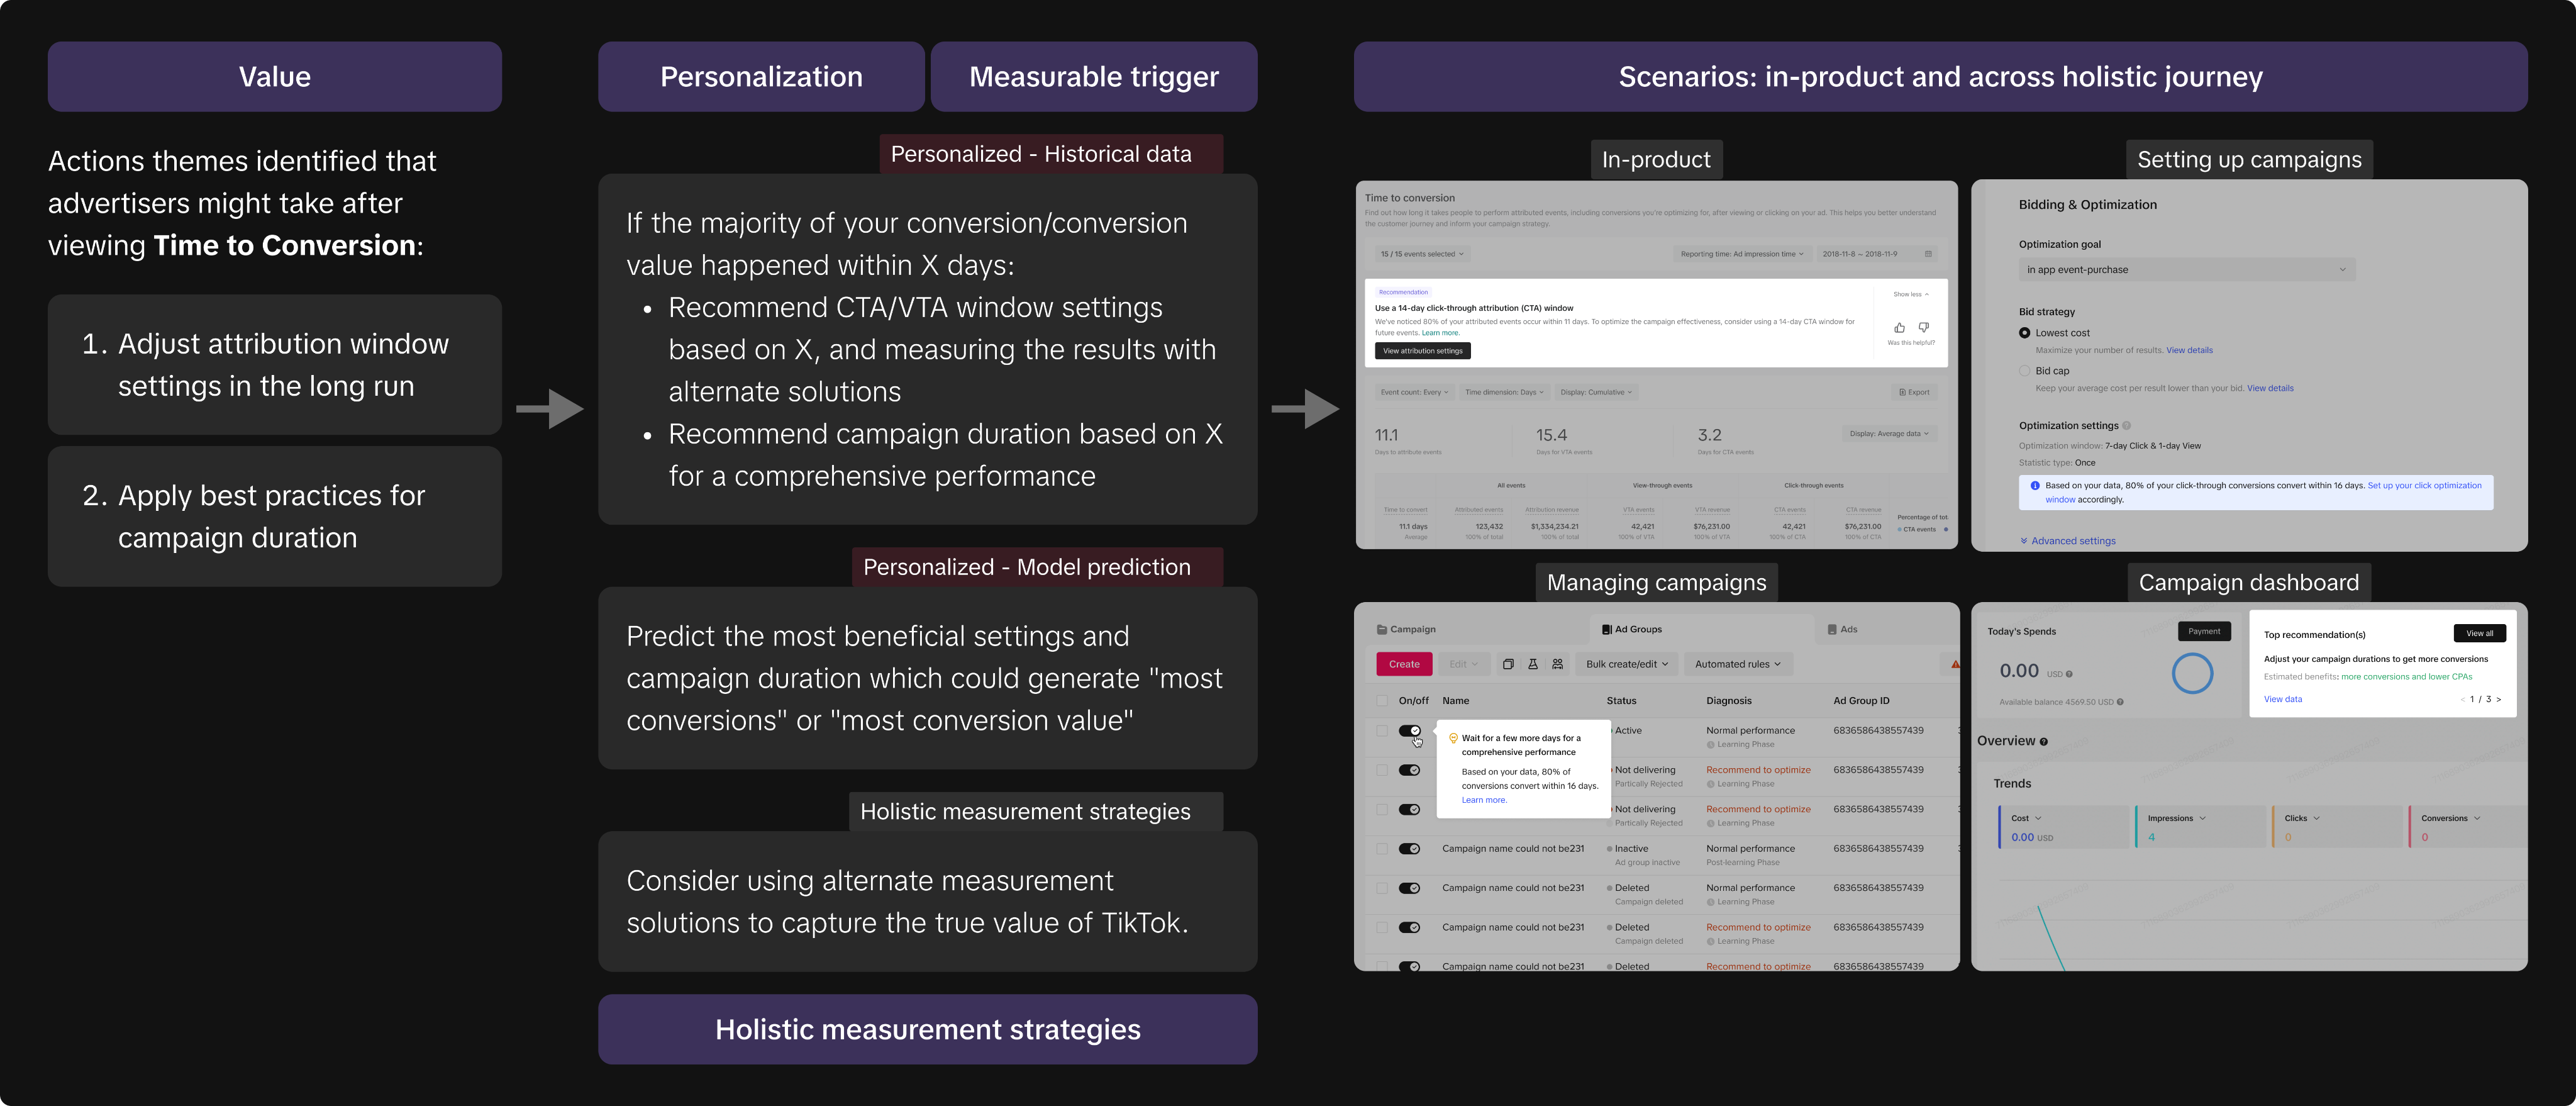
Among these, I identified two key recommendation strategies with initiatives:
- Prompt valuable, personalized, and measurable recommendations in the right scenariosEmbed actionable prompts tied to business value, tailored to advertiser context, and triggered with measurable data at key decision points.
- Promote holistic measurement strategiesEncourage adoption of complementary solutions such as conversion lift, post-purchase surveys, brand lift, and multi-touch attribution to capture TikTok’s full impact.
Most of these initiatives had transitioned into development work before my departure, ensuring the product continued improving actionability and business impact.
Recommendation strategies to improve data actionability


TikTok Attribution Analytics: From Concept to Launch
Summary
I led the design of TikTok’s first comprehensive attribution platform — Attribution Analytics, addressing advertiser trust gaps caused by data discrepancies and last-click bias. Within a year, the team launched four core data features globally and an internal insights tool with advanced metrics. By driving data visualization design, hypothesis-driven research, and iterative validation, the platform increased revenue penetration to 26%-62% across SMB–KA segments. I also facilitated xfn retros to improve workflows, shaped the product roadmap using data-driven prioritization frameworks, and led design workshops to enhance data actionability and user education. The result was a trusted, action-oriented measurement solution that clarified true conversion value and informed advertiser optimization decision-making.
My Role
Lead Designer
Company
TikTok
Date
2023-2024
Scope
12 months; 15+ XFN partners across PM, Data Science, UXR, Content, Client-facing teams, Engineering, QA, Visual design, and partner product teams
Background
Attribution refers to identifying the contribution of different marketing channels along the customer journey, helping advertisers understand which ad campaign touchpoints actually drive conversions. Accurate attribution directly impacts advertiser trust and campaign strategy, which in turn affects ad revenue.
Our team’s starting point was Attribution Manager, TikTok’s first user-facing attribution product. However, advertiser feedback quickly revealed that this settings-only tool was insufficient.
Problem
Through advertiser feedback and market research, we identified a critical gap: there was no effective attribution solution—either within TikTok or in the broader market—that could highlight TikTok’s unique value (e.g., view-through conversions, longer conversion cycles, and multi-touch journeys vs. traditional last-click models).
As a result, advertisers struggled to recognize TikTok’s true impact. For example, a post-purchase survey revealed that 79% of TikTok-driven purchases were not captured by last-click measurement. This erosion of trust made it an urgent priority to deliver a new attribution solution.
Our team introduced Attribution Analytics, a data insights product designed to:
- Highlight TikTok’s unique consumer journey beyond last-click.
- Strengthen advertiser trust and investment in TikTok ads by providing more accurate, actionable insights.
In this case study, I’ll cover two major milestones:
- Rapidly design and validate 10 high-value data feature concepts in user research;
- Launch prioritized features as MVP, then scale and optimize across the full feature set.
Approach & Design Strategy
Challenges
Two product-specific challenges:
- This was a brand new product, with many attribution features that had no direct market benchmarks.
- Initial requirements were highly ambiguous. We needed to explore and define critical details—what data to include, at what dimension and granularity, and how each element could deliver value.
Two challenges observed in existing measurement products:
- Low actionability & interpretability: insights were difficult to apply, leading to trust gaps.
- Divergent advertiser needs: KA required multi-dimensional attribution depth, SMBs needed simplified roll-ups, and MM demanded a balance of detail and efficiency.
Design Strategy
To address these, I developed five guiding principles for designing Attribution Analytics:
- Define Metrics & Dimensions: Reveal data that delivers value. Structure revenue-relevant metrics into KPIs, dimensions into primary scopes, secondary filters, and time ranges as standardized building blocks.
- Granularity & Aggregation: Balance detailed drill-downs and high-level roll-ups, serving different levels of measurement sophistication while preventing data overload.
- Effective visualization: Use charts, tables, KPI cards (quick checks), interactive filters (granularity control), narratives (clarity), and dashboards (holistic views) to improve perceived value and reduce cognitive load.
- Actionability: Surface the right next step at the right time. Frame recommendations around business value, personalization level, measurable triggers, and contextual scenarios.
- Product Education: Embed clear, contextual, and consistent narratives across all touchpoints to improve perceived value, trust, and adoption.
Design strategy: defining metrics and dimensions, granularity & aggregation, visualization, actionability, and product education.
Vision Prototype
From ambiguous to concrete
Partnering with Product and Data Science, I designed 10 medium-fidelity data feature proposals.
Challenges I addressed:
- Analyzed real advertiser data to translate vague requirements into effective scenarios for each feature.
- Proposed and revised 20+ hypotheses around metrics, dimensions, visualization, and actionability.
- Selected a proper tool for rapid prototyping, balancing visualization capability, compatibility, and reusability.
Desirability prioritization metrics
To prioritize desirability of each feature, PM and I defined three core metrics:
- Reliability – can advertisers trust this data?
- Interpretability – can advertisers easily understand the data?
- Actionability – can this data guide next steps effectively?
Validation and iteration
Over 6 weeks, with close collaboration across Design, UXR, Product, and Data Science:
- Prototyped 60 interactive prototypes with live data for each advertiser, ensuring feedback reflected real-world user behavior;
- Rapidly completed 33 design iterations, evolving from 20 to 65+ validated hypotheses;
- Improved every feature across reliability and interpretability.
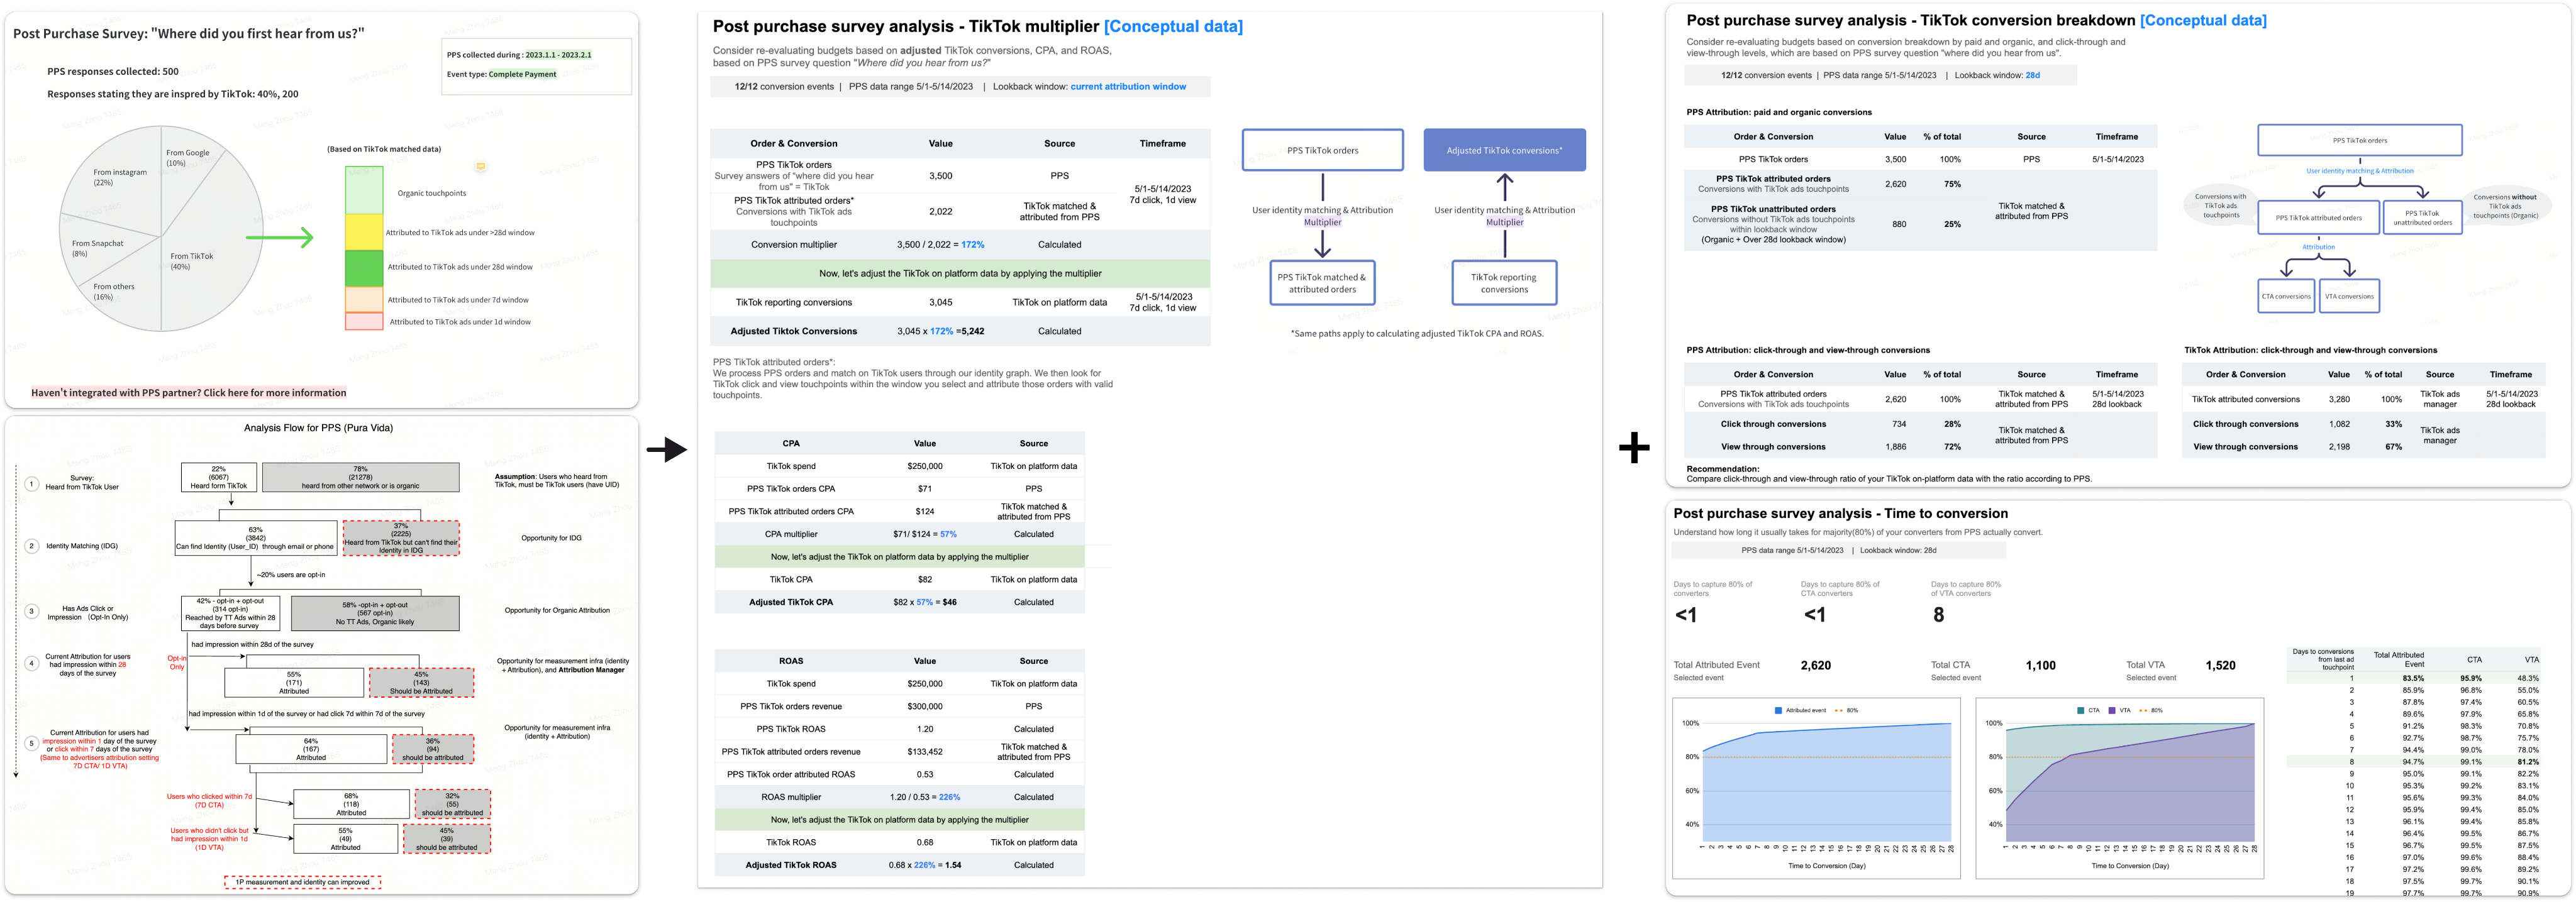
Example: 10 features after 33 iterations, from concept to medium-fi interactive prototypes, validated with real data and user feedback.
Example: Progressive validation journey for Time to Conversion feature
Defining, testing, and iterating on:
1. Metrics & dimensions & granularity hypotheses: What data to show, and at what granularity?
2. Visualization hypotheses: How should the data be displayed for clarity?
3. Product education hypotheses: How do we help advertisers interpret and act on insights?
MVP
Prioritization and roadmap
To complement the three desirability metrics (Reliability, Interpretability, Actionability), we added two feasibility dimensions post vision prototype validation:
- Data Scalability: Can data support all major advertiser types and scenarios?
- Data Quality: Is the data accurate, complete, consistent, and timely, reflecting true TikTok conversion value?
Using this five-dimensional prioritization framework (Reliability, Interpretability, Actionability, Data Scalability, Data Quality), we built the roadmap:
- 4 features for MVP, delivering rapid market value.
- Remaining features implemented in an internal data insights tool used by client-facing teams to support advertisers and collect ongoing feedback.
MVP Launch
After a year of iterative design, validation, and cross-functional collaboration, we launched Attribution Analytics through staged rollouts — evolving from a single-feature alpha to limited-market betas, and ultimately to global GA with four core features, supported by a structured GTM plan.
Information architecture & layout framework
I designed the overall product layout to organize features, dimensions, recommendations, data insights, customer feedback, and settings into a clear hierarchy. This reduced complexity, ensured consistency, and made data exploration intuitive.
Core features
Performance Comparison (merged from two features):
Compare conversions across attribution windows, reveal click vs. view impact on KPIs (CPA, ROAS, Revenue).
Time to Conversion:
Reveal consumer behavior patterns and conversion delays, and their impact on revenue, guiding advertisers in budget allocation and campaign timing.
Touchpoints to Conversion:
Visualize full conversion paths and their impact on revenue, emphasizing TikTok’s role in multi-touch attribution.
Product education in GTM
Embedding education into GTM from in-product guidance to sales, internal training, and external comms, ensuring consistent narratives, clear education, and trusted and action-oriented communication.
Progressive disclosure to support advertisers with different levels of measurement sophistication
Defaulting dimensions and filters to the most valuable/commonly used views to reduce cognitive load
New feature interactive introductions to guide discovery and adoption
Contextual narratives explaining complex terms
Clear and transparent communication of data coverage, accuracy, timeliness, quality risks, and privacy compliance
Internal training materials, Help Center updates, and PR content aligned with in-product experience
Internal measurement insights tool
In parallel, we launched an internal measurement insights tool with additional features, earning strong feedback from client-facing teams and advertisers for continued improvements.
Product/Market Fit
Market validation
Post-MVP, market data validated product value:
- Revenue penetration: 59% KA, 62% MM, 26% SMB (vs. 20–40% typical for new products; >50% = mainstream adoption)
- Spend impact: +53% WoW for users vs. +28% non-users during BFCM (vs. 5–10% typical spend uplift).
- Revenue impact: ARPA +52% YoY for adopters vs. +22% non-users (vs. 10–20% benchmark uplift).
- Product education impact: NPS in global training improved from 48% to 84% (vs. +20 points benchmark = major success). Sales, client solutions, and measurement partner teams noted data insights were intuitive and actionable.
- Market feedback: Widely covered by industry press as a first-party solution addressing last-click limitations. Experts praised its richer conversion view while noting inherent first-party data limits.
“Having visibility into extra click-through and view-through event data has made it easier to prove TikTok's value and scale our clients' campaigns.” – Senior strategist, Power Digital Marketing
Scaling actionability
During user research, we uncovered the biggest challenge advertisers faced: after seeing attribution data, they could not immediately determine what real-world actions to take. This hesitation came from two factors—the unfamiliarity with new attribution metrics, and the need to cross-check with other sources before deciding.
To address this challenge, I led a Design & Prioritization Workshop. Together, we generated 17 actionable themes across the four MVP features, each aimed at encouraging advertisers to act confidently on insights.
Among these, I identified two key recommendation strategies with initiatives:
- Prompt valuable, personalized, and measurable recommendations in the right scenariosEmbed actionable prompts tied to business value, tailored to advertiser context, and triggered with measurable data at key decision points.
- Promote holistic measurement strategiesEncourage adoption of complementary solutions such as conversion lift, post-purchase surveys, brand lift, and multi-touch attribution to capture TikTok’s full impact.
Most of these initiatives had transitioned into development work before my departure, ensuring the product continued improving actionability and business impact.
Recommendation strategies to improve data actionability